Transcription of United States Small Business Economic Profile
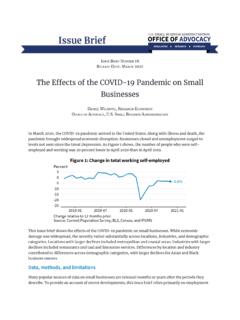
1 2021 Small Business Small Business ADMINISTRATIONU nited States million Small businesses million Small Business employees percent of US businesses percent of US employees 5060 PercentShare of employees working at Small businesses by state Source of data: Statistics of US businesses (Census) Business dynamics Establishments Between March 2019 and March 2020, million US establishments opened and 993,809 closed, for a net increase of 42,650. Employment expanded at million and contracted at million. Small businesses accounted for 909,808 openings and 843,229 closings. Employment Opening and expanding US establishments added million jobs, while closing and contracting establishments lost million, for a net increase of 406,001 jobs.
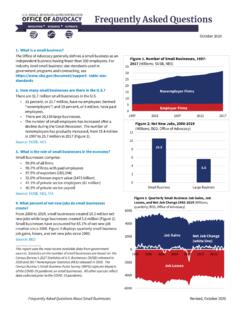
2 Small businesses gained million jobs and lost million, for a net increase of 466,607 jobs. OpeningsClosings Net change of establishmentsGains LossesNet change -10010200020102020 Millions of jobs Counts include temporary closures and reopenings Source: Business Employment Dynamics (BLS) 1 gggySmall Business loans The Community Reinvestment Act New lending to businesses with revenues under $1 million requires large banks to report new Small Business loans. In 2019, reporting banks issued $ billion in loans to US businesses with revenues of $1 million or less. Total reported new lending to businesses through loans of $100,000 or less was $ billion, and total reported new lending to businesses through loans of $1 million or less was $ billion.
3 Source: gCRA Aggregate Data (FFIEC) 05010020002005201020152020$BillionSmall Business count by size and industry No 1 19 20 499 All Small Industry employees employees employees businesses Professional, Scientific, and Technical Services 3,726,651 767,250 50,525 4,544,426 Other Services (except Public Administration) 2,978,235 654,326 45,851 3,678,412 Construction 2,635,432 659,092 59,193 3,353,717 Real Estate and Rental and Leasing 2,876,253 306,687 13,005 3,195,945 Administrative, Support, and Waste Management 2,521,600 309,104 38,871 2,869,575 Transportation and Warehousing 2,572,386 170,528 19,880 2,762,794 Retail Trade 2,103,399 584,707 55,851 2,743,957 Health Care and Social Assistance 2,071,125 569,523 89,831 2,730,479 Arts, Entertainment, and Recreation 1,513,725 116,811 16,797 1,647,333 Accommodation and Food Services 459,908 420,092 126,494 1,006,494 Finance and Insurance 755,353 221,636 15,897 992,886 Educational Services 806.
4 465 74,899 19,323 900,687 Wholesale Trade 399,400 250,016 40,778 690,194 Manufacturing 354,100 183,318 58,877 596,295 Information 358,505 70,584 10,417 439,506 Agriculture, Forestry, Fishing and Hunting 256,372 21,272 1,354 278,998 Mining, Quarrying, and Oil and Gas Extraction 82,524 15,655 3,051 101,230 Utilities 14,099 4,598 1,225 19,922 Management of Companies and Enterprises * 4,702 13,851 18,553 Industries not classified * 12,114 43 12,157 Total 26,485,532 5,411,180 644,241 32,540,953 * Not reported by the Census Bureau Sources: Nonemployer Statistics, 2018 (Census); Statistics of US businesses , 2018 (Census) Small Business exports A total of 288,063 identified firms exported goods worth $ trillion from the United States in 2019.
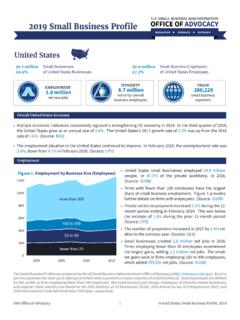
5 Of those exporters, 280,496 or percent were Small . Small firms exported goods worth $ billion, making up percent of exports by identified firms. Source: A Profile of US importing and exporting companies, 2018 2019 (Census) United States 2021 2 SBA Office of Advocacy pyyyyggpBusiness ownership share by demographic group Women Veterans Hispanics Racial minorities OwnershipWorkersOwnershipWorkersOwnershi pWorkersOwnershipWorkersWomen made up percent of workers and owned percent of businesses . Veterans made up percent of workers and owned percent of businesses . Hispanics made up percent of workers and owned percent of businesses .
6 Racial minorities made up percent of workers and owned percent of businesses . Ownership shares include equal and majority ownership Sources of data: American Community Survey, 2018 (Census and IPUMS); Annual Business Survey, 2018 (Census); Nonemployer Statistics by Demographics, 2017 (Census) Business count by owner demographic group Without With Ownership employees employees Total Female 10,550,000 1,141,410 11,691,410 Male 13,910,000 3,496,959 17,406,959 Owned equally by both groups 612,000 860,754 1,472,754 Veteran 1,421,000 337,934 1,758,934 Not veteran 23,550,000 5,015,409 28,565,409 Owned equally by both groups 100,000 145,782 245,782 Hispanic 3,635,000 331,625 3,966,625 Not Hispanic 21,390,000 5,118,211 26,508,211 Owned equally by both groups 44,500 49,285 93,785 American Indian and Alaska Native 84,500 24,433 108,933 Asian 1,960,000 577,835 2,537,835 Black or African American 2,951,000 124,551 3,075.
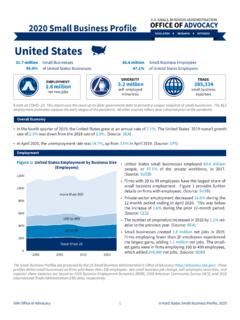
7 551 Native Hawaiian and Other Pacific Islander 38,500 6,653 45,153 White 19,990,000 4,769,883 24,759,883 Hispanic or racial minority 8,169,000 1,048,323 9,217,323 White and not Hispanic 16,830,000 4,364,169 21,194,169 Owned equally by both groups 75,000 86,633 161,633 Counts include only businesses classifiable by owner demographic group Sources: Annual Business Survey, 2018 (Census); Nonemployer Statistics by Demographics, 2017 (Census) United States 2021 3 SBA Office of Advocacy ggggpp pp///pyyyggTotal US employment by Business size Source of data: Statistics of US businesses (Census) fewer than 2020 to 99100 to 499500 employees or more025507510012519952000200520102015 MillionG Between 1994 and 2018, US Small Business employment grew by percent, reaching million employees in 2018.
8 G Small Business employment and payroll by industry Employers Employment Payroll ($1,000s) Industry Small % Small % Small % Professional, Scientific, and Technical Services 817,775 5,259,413 403,772,227 Construction 718,285 5,572,962 329,198,011 Other Services (except Public Administration) 700,177 4,736,342 151,225,071 Health Care and Social Assistance 659,354 9,064,362 378,490,065 Retail Trade 640,558 5,498,587 188,107,293 Accommodation and Food Services 546,586 8,688,379 167,696,424 Administrative, Support, and Waste Management 347,975 3,802,335 150,476,792 Real Estate and Rental and Leasing 319,692 1,481,216 77,607,070 Wholesale Trade 290,794 3,390,716 213,346,333 Manufacturing 242,195 5,079,058 259,718,593 Finance and Insurance 237,533 1,903,886 162,022,396 Transportation and Warehousing 190,408 1,719,572 78,455,197 Arts, Entertainment.
9 And Recreation 133,608 1,458,450 53,198,081 Educational Services 94,222 1,684,311 58,485,906 Information 81,001 987,519 77,881,093 Agriculture, Forestry, Fishing and Hunting 22,626 138,005 6,144,459 Mining, Quarrying, and Oil and Gas Extraction 18,706 261,547 22,019,535 Management of Companies and Enterprises 18,553 393,039 31,945,559 Industries not classified 12,157 13,875 448,866 Utilities 5,823 110,457 8,850,934 Total 6,055,421 61,244,031 2,819,089,905 Source: Statistics of US businesses , 2018 (Census) About this Profile Small businesses are defined here as firms with fewer than 500 employees.
10 Figures and statistics may incorporate approximations because of missing or otherwise problematic data. Data analyzed here predate the COVID-19 pandemic, the impacts of which have differed by industry, geography, and demographic group. More information about the impacts of the pandemic, electronic versions of these and other geographic profiles, and additional resources are available at United States 2021 4 SBA Office of Advocacy