Transcription of Using Your TI-83/84 Calculator: Normal Probability …
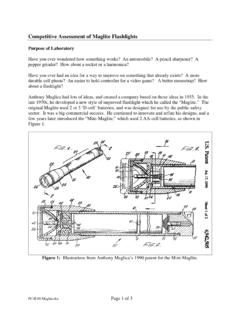
1 Using Your TI-83/ 84 calculator : Normal Probability DistributionsElementary StatisticsDr. Laura SchultzAlways start by drawing a sketch of the Normal distribution that you are working with. Shade in the area ( Probability ) that you are given or trying to find, and label the mean, standard deviation, lower bound, and upper bound that you are given or trying to find. Don't worry about making your drawing to scale; the purpose of the sketch is to get you thinking clearly about the problem you are trying to solve. For illustration purposes, let s consider the distribution of adult scores on the Weschler IQ test.
2 These IQ scores are normally distributed with = 100 and = the normalcdf commandThe normalcdf command is used for finding an area under the Normal density curve. This area corresponds to the Probability of randomly selecting a value between the specified lower and upper bounds. You can also interpret this area as the percentage of all values that fall between the two specified boundaries. s find the percentage of adults who score between 90 and 110 on the Weschler IQ test. Begin by sketching the distribution and labeling the relevant information. We are ultimately trying to find the area under the Normal density curve that is bounded by 90 and 110, so shade in that area on your sketch.
3 `v for the = menu. Scroll down to 2:normalcdf( and then press the two x values (or z scores) that form the boundaries of the area that you are trying to find, the population mean, and the population standard deviation Using the following syntax: lowerbound,upperbound, , ) and then press e. For this example, type 90,110,100,15) and then press calculator will return the area under the Normal curve bounded by 90 and 110. Thus, we find that of adults score between 90 and 110 on the Weschler IQ test. Remember to round percentages to three significant is the Probability that a randomly selected adult scores less than 120 on the Weschler IQ test?
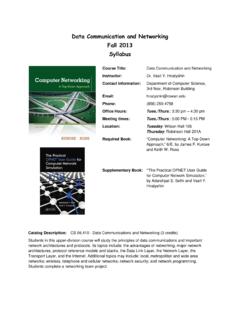
4 Problems like this are a bit trickier because your calculator requires both a lower bound and an upper bound. Ultimately, you need to specify an approximation of - for the lower bound. In most cases, -999999 is a good choice for the lower bound. Hence, the syntax for problems of this sort is normalcdf(-999999,upperbound, , ). by drawing a sketch. Then, press `v for the = menu. Scroll down to 2:normalcdf( and press e. Type _999999,120,100,15) and then press e again. We find that the Probability of randomly selecting an adult whose IQ is below 120 is In symbols, P(x 120) = Remember to round Probability values to 3 significant 2007 by Laura Schultz.
5 All rights reserved. Page 1 of 3 = 100 = 1590110120-999999 = 100 = percentage of adults score at least 90 on the Weschler IQ test? Because your calculator requires both a lower bound and an upper bound, you will need to specify an approximation of for your upper bound. Using 999999 is good enough in most cases. Hence, the syntax for problems of this sort is normalcdf(lowerbound,999999, , ). by drawing a sketch. Then, press `v for the = menu. Scroll down to 2:normalcdf( and press e. Type 90,999999,100,15) and then press e find that of adults score at least 90 on the Weschler IQ test.
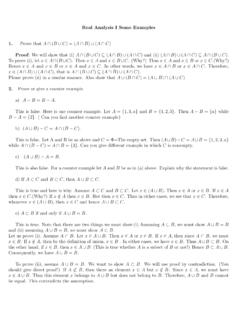
6 Remember to round to 3 significant the invNorm commandUse the invNorm command when you are given a Probability or percentage and asked to find an x value or z score. This command is often used to find values corresponding to percentiles or quartiles. Your calculator requires that you enter the cumulative area to the left of the desired value; drawing a sketch is very useful for making sure you enter the correct area. Sometimes you will need to work with an area other than the one specified by the `v for the = menu. Scroll down to 3:invNorm( and press s start by finding the IQ score corresponding to the 95th percentile (P95).)
7 Begin by drawing a sketch and labeling the total area to the left of the desired x value (or z score) Using the following syntax: invNorm(area to left, , ) and then press e. For this example, type 95,100,15) and then press calculator will return the x value (or z score). For this example, we find that the Weschler IQ score corresponding to the 95th percentile is Round your answer to one more decimal place than what was provided for . s try a trickier example. This time, find the IQ score separating the top 15% of all Weschler IQ scores from the rest. Start by drawing a sketch.
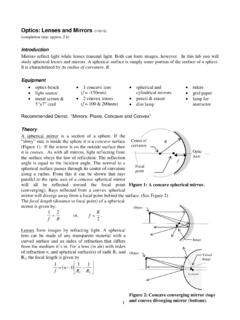
8 Given that the total area under the Normal density curve is always 1, the area to the left of the IQ score that we are seeking can be found by subtracting the given area from 1. In this case, 1 - = Don t forget to convert percentages to their equivalent decimal `v for the = menu. Scroll down to 3:invNorm( and press area to the left of the IQ score we are seeking is , so type ,100,15) and then press e. We find that an IQ score of separates the top 15% of all adult Weschler IQ scores from the 2007 by Laura Schultz. All rights reserved. Page 2 of 390999999 = 100 = 15P95 Area to left = = 100 = 15xArea to left = = 100 = 15 Applying the Central Limit Theorem (Working with sample means) The Central Limit Theorem applies whenever you are working with a distribution of sample means ( x), and the sample comes from a normally distributed population, and/or the sample size is at least 30 (n 30).
9 Recall that the mean for a distribution of sample means is , and the standard deviation for a distribution of sample means is . Thus, the modified calculator commands to use when you are applying the Central Limit Theorem to work with sample means ( x) are as follows:normalcdf(lowerbound,upperbound, , ) normalcdf(-999999,upperbound, , )normalcdf(lowerbound,999999, , ) invNorm(area to left, , )Copyright 2007 by Laura Schultz. All rights reserved. Page 3 of 3 x= x= n n n n