Transcription of VEHICLE VOLUME DISTRIBUTIONS BY CLASSIFICATION
1 VEHICLE VOLUME DISTRIBUTIONSVEHICLE VOLUME DISTRIBUTIONSBY CLASSIFICATIONBY CLASSIFICATIONP repared byMark Hallenbeck, DirectorMian Rice, Research AssistantWashington State Transportation Center (TRAC)Betty Smith, ResearcherCindy Cornell-Martinez, Director of ResearchJoe Wilkinson, Chairman of the BoardChaparral Systems CorporationJuly 1997 Chaparral SystemsChaparral SystemsCorporationCorporationWashington StateWashington StateTransportation CenterTransportation CenteriDISCLAIMERThe contents of this report reflect the views of the authors, who are responsible for thefacts and the accuracy of the data presented herein. The contents do not necessarilyreflect the official views or policies of the Federal Highway Administration. Thisreport does not constitute a standard, specification, or OF CONTENTSINTRODUCTION AND BACKGROUND of the Study of Findings to Other Sites in the CLASSIFICATION Categories BY of Factor of Local BY VERSUS RURAL PERCENTAGES BY FUNCTIONAL Variation by VEHICLE in Factors by Functional CLASSIFICATION of of Low by versus Rural Percentages by Functional class of (Monthly) of Represented in the Study (number of sites indicated).
2 Classes of FHWA VEHICLE of Sites with Sunday Day-of-Week Factors for CombinationTrucks within a Specified Patterns at Nebraska Site Time-of-Day Day Trucking Time-of-Day distribution for Multi-Trailer Trucks at Site Truck in Combination Truck Travel by Truck Percentages by Functional class and versus Weekend Automobile Factors by Aggregated VEHICLE of Single-Unit Truck Passenger VEHICLE VOLUME Patterns by Functional Single-Unit Truck VOLUME Patterns by Functional Combination Truck VOLUME Patterns by Functional Multi-Trailer Truck VOLUME Patterns by Functional of of Sites per State for Each Functional of Sites per Region for Each Functional Patterns for Urban and Rural Average Truck Percentages by Functional Classificationof Percentage Chart for Each Functional of Sites per LTPP Region for Each Functional Factors for Aggregated VEHICLE Classes by for All Roadway Classes of Monthly Tavel Factors by VEHICLE VOLUME DISTRIBUTIONSBY CLASSIFICATIONINTRODUCTION AND BACKGROUND MATERIALThis report documents the findings of a study of variability in traffic volumes by vehicleclassification.
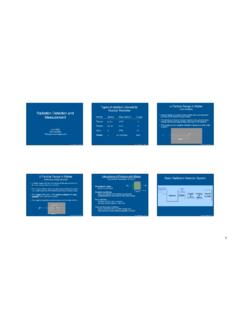
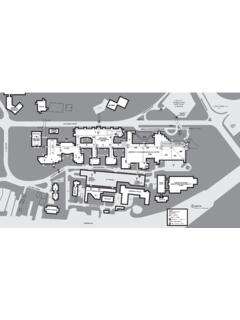
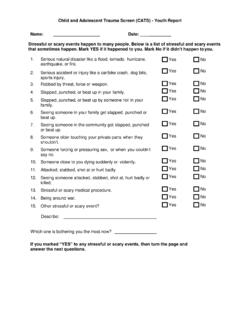
3 It is meant to update the report, Highway Performance Monitoring System, VEHICLE CLASSIFICATION Case Study, by Douglas MacTavish and Donald Neuman (1982). Thisproject studied data from a broader geographic distribution of those sites and included a largerdata collection period at each of the Study DataData for the study came from the Central Traffic Data Base of the Long-Term PavementPerformance (LTPP) project. The dataset contained 99 sites from 19 states. Table 1 showsthe distribution of sites by state and functional CLASSIFICATION . Figure 1 shows their geographicdistribution. Table 2 shows how these sites are distributed among LTPP regions. These tablesreveal that relatively few sites were included in the two smallest functional classifications ofroads, class 7 and class 16. (See Figure 2 for a definition of the Federal HighwayAdministration [FHWA] functional classifications of roads.)
4 These are under-representedbecause these types of roads are relatively scarce within the LTPP experiment, and becausestates participating in the LTPP experiment have tended to collect data for larger VOLUME ,higher functional CLASSIFICATION be selected for this analysis, an LTPP site needed data for all 7 days of the week, for morethan 9 months of the year. For the larger functional classes of roadway (classes 1, 2, and 11),only sites that contained data for all lanes and both directions of traffic were selected. For theother roadways, sites that had data for only one direction of traffic were also accepted,although some analyses looked only at the subset of sites with data for both directions 1. Number of Sites per State for Each Functional ClassSTATEFC 1 FC 2 FC 6 FC 7 FC 11 FC 12 FC 14 FC 16 TotalAlabama331000007 Arkansas100000001 California300000003 Florida020000002 Indiana3441001013 Iowa010000001 Kansas000000101 Kentucky010001002 Massachusetts110000002 Minnesota001021004 Mississippi100010002 Missouri003110005 Nebraska6200201011 New York010000102 Pennsylvania110000002 Texas0062402115 Vermont030000003 Virginia2321201011 Washington2500112112 Total23271751339299 Washington12 MontanaIdahoOregonWyomingNorth DakotaSouth DakotaNevadaCalifornia3 UtahColoradoNebraska11 Kansas1 ArizonaNew MexicoTexas15 OklahomaMinnesota4 Iowa1 Missouri5 Arkansas1 WisconsinIllinoisTennesseeMichiganIndian a13 LouisianaMississippiFloridaGeorgiaSouthC arolinaNorth CarolinaKentucky2 Virginia11 OhioWestVirginiaPennsylvania2 NewYork2 MaineVermontNew
5 HampshireConnecticutDelawareDistrict of ColumbiaMarylandNew JerseyMassachusettsAlabama7 Rhode Island2322 Figure 1. States Represented in the Study (number of sites indicated)3 Table 2. Number of Sites per Region for Each Functional ClassREGION FC 1 FC 2 FC 6 FC 7 FC 11 FC 12 FC 14 FC 16 TotalATLANTIC 4921202020 CENTRAL 9882523037 SOUTH 5572502127 WEST 5500112115 Total23271751339299 class 1 =Rural InterstateClass 2 = Rural Principal ArterialClass 6 = Rural Minor ArterialClass 7 = Rural Major CollectorClass 8 = Rural Minor CollectorClass 11 = Urban InterstateClass 12 = Urban Other Freeways and ExpresswaysClass 14 = Urban Principal ArterialClass 16 = Urban Minor ArterialClass 17 = Urban CollectorFigure 2. Functional Classes of RoadwaysThe data supplied by the states were collected by permanently installed VEHICLE classificationand weigh-in-motion (WIM) equipment placed for the LTPP research tests.
6 Because thesesites were not selected to provide information on a specific set of traffic movements ( ,recreational movements important to a state), they should provide a reasonably unbiasedsample of traffic conditions within the However, the traffic patterns found in the greatly and the number of sites in this study was relatively small in comparison to therange of possible traffic patterns, particularly those found on the lower urban and ruralfunctional road classes. Thus, some care must be taken when using these study results forgeneral data used in this study had all passed through the LTPP quality assurance1 process andwere further screened as part of this analysis. In addition to removing invalid data, thescreening found some questionable traffic volumes for individual days and sites. These dataerrors were minor in relation to the overall analyses, and tests on the effects of these datashowed that their impacts were marginal.
7 However, the presence of these minor perturbationsin the data, despite the extensive LTPP quality control and quality assurance tests, showed theneed for individual states to adopt and extend these kinds of tests. Data presented in theappendices of this report are based on the cleanest possible data within the LTPP of Findings to Other Sites in the NationThe majority of results presented in this report are for the average conditions found in thedata. Considerable variation was found in the data reviewed for individual , readers using these results should be aware that individual sites may varyconsiderably from these patterns. This is particularly true of the percentage of vehicles byvehicle category, since some VEHICLE categories are not commonly found in some parts of possible, this report includes measures of data variability to describe the range of valuesthat can be reasonably expected at any given site.
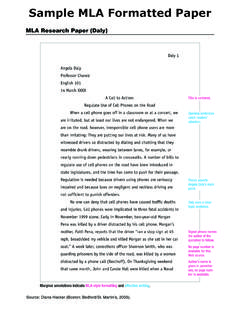
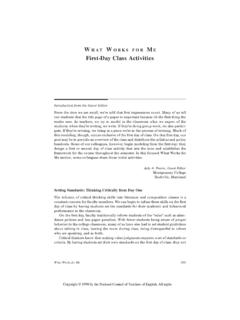
8 However, it is important to realize that localconditions significantly affect the traffic patterns found on any roadway and, therefore, thatpatterns at any given location can differ greatly from those illustrated in this CLASSIFICATION Categories UsedFHWA requests that VEHICLE CLASSIFICATION information be submitted in 13 VEHICLE VEHICLE categories are shown in Figure 3. In some of the tables presented in this report,data are presented for all 13 VEHICLE categories; however, many of the report s tables and 1A brief description of the LTPP quality assurance process can be found in WIM Data Quality Assurance in VOLUME II of the National Traffic Data Acquisition Conference, 1994, pages contain an aggregated VEHICLE CLASSIFICATION scheme. This CLASSIFICATION scheme usesfour broad categories of vehicles: Passenger cars.
9 Single-unit trucks. Combination trucks. Multi-trailer 1 =MotorcyclesClass 2 =Passenger carsClass 3 = Other 2-axle, 4-tire single-unitvehiclesClass 4 =BusesClass 5 =2-axle, 6-tire single-unit trucksClass 6 =3-axle, 6-tire single-unit trucksClass 7 =4+ axle single-unit trucksClass 8 =4 or less axle combination trucksClass 9 =5-axle combination trucksClass 10 =6+ axle combination trucksClass 11 =5-axle multi-trailer trucksClass 12 =6-axle multi-trailer trucksClass 13 =7+ axle multi-trailer trucksFigure 3. 13 FHWA VEHICLE ClassesThese higher aggregations are used for several reasons. At many sites, the daily volumes within some VEHICLE categories are so small thatthe factors (or ratios) produced are not stable. These unstable values caused anunrealistically high degree of variability in the mean factors computed for those6vehicle classes for various aggregations ( , mean day-of-week or monthly factorsby functional class of roadway or region of the country).
10 In many cases, the traffic patterns for many VEHICLE classes were very similar, andaggregating the FHWA classes allowed a simplified explanation of the results. Modern automated VEHICLE CLASSIFICATION equipment often has difficultydifferentiating among specific VEHICLE types, and the data were more accuratelytreated at a more aggregated level. (For example, most VEHICLE classifiers haveproblems reliably differentiating between some class 2, class 3, and class 5vehicles, since all of these VEHICLE categories contain two axles and the wheel basesof some types of vehicles (particularly pickup trucks) fall near the axle spacingborders of these three OrganizationThis report is separated into the following sections: Volumes by day of week. Volumes by time of day. Urban versus rural volumes. VEHICLE percentages by functional CLASSIFICATION of road. Seasonal patterns.)