Transcription of VISIBLE SPECTROSCOPY - faculty.sites.uci.edu
1 VISIBLE SPECTROSCOPY Revised 11/21/14 1 VISIBLE SPECTROSCOPY VISIBLE SPECTROSCOPY is the study of the interaction of radiation from the VISIBLE part ( = 380 - 720 nm) of the electromagnetic spectrum with a chemical species. Quantifying the interaction of VISIBLE light with a chemical sample allows for the determination of an unknown solution concentration, the monitoring of reaction progress as a function of time, and many other quantitative uses. Understanding VISIBLE SPECTROSCOPY requires understanding VISIBLE light. Light travels in packets of energy called photons. Each photon has a specific energy related to a certain frequency or wavelength (E = h = hc/ ).
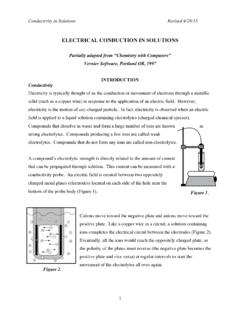
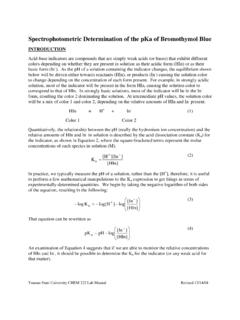
2 VISIBLE light consists of wavelengths ranging from 380 nm ( blue violet) to 720 nm (red). When all wavelengths of VISIBLE light are present, the light appears "white" to our eyes. If any wavelength is removed (absorbed), we perceive the remaining combination of wavelengths of light as the "complimentary" color (Table 1, Figure 1). Table 1: Absorbed & Perceived Colors Absorbed Wavelength (nm) Absorbed Color Perceived (Transmitted) Color 400 violet green - yellow 450 indigo yellow 480 blue orange 490 blue -green red 530 green purple 570 yellow-green dark blue 600 orange blue 650 red green Figure 1: Color Wheel redorangeyellowvioletbluegreen7506305905 60480430400 Colored compounds are colored because of the absorption of VISIBLE radiation.
3 The color is a result of the compound absorbing a certain color of light, leading to the perception of the compound being the complimentary color. For example, if white light passes through a test tube containing a solution of copper (II) sulfate (CuSO4), the solution will be blue because the Cu2+ ions strongly absorb orange photons of light (photons of light with ~ 600 nm). VISIBLE SPECTROSCOPY Revised 11/21/14 2 When a photon of colored light is absorbed by a compound an electron transitions from lower energy orbital to higher energy orbital. The energy of absorbed radiation is equal to the energy difference between the highest energy electronic occupied orbital (OO) and the closest unoccupied orbital (UO).
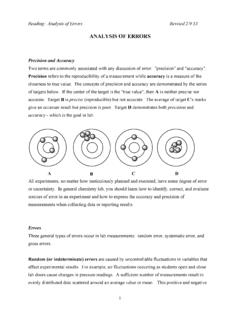
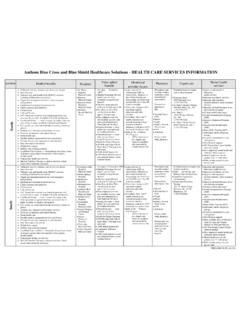
4 Many transition metal complexes and large conjugated organic molecules are brightly colored because this energy difference is equal to an energy within the VISIBLE region of the electromagnetic spectrum. Mathematically, this relationship is expressed by equation 1: (1) Elight = h light = hc/ light = E = EUO EOO Before the absorption of a photon, the electrons within the compound are in the lowest energy orbitals possible. Such an electron configuration is called the ground state. When a photon of VISIBLE radiation is absorbed by a compound an electron is promoted from an occupied orbital to an unoccupied orbital.
5 The result is a higher energy compound in an excited state. (Figure 2) OccupiedOrbitalUnoccupiedOrbitalEOOEUOEO OEUOh lightEOOEUOG round State Electron ConfigurationExcited State Electron ConfigurationAbsorption of a Photon of VISIBLE Light Figure 2. Absorption of light resulting in the excitation of an electron The wavelength ( , frequency, energy, or color) of light required to promote an electron from the ground to the excited state is specific to each chemical, just as the energy difference between EOO and EUO is dependent on chemical identity. Most methods of measuring absorbance required that the compound be in the liquid form or dissolved in a liquid solution.
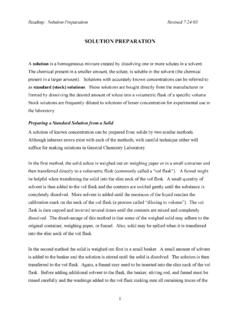
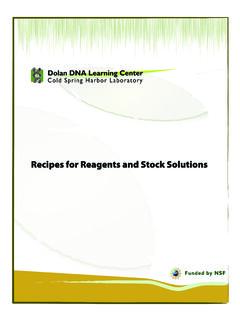
6 Once in solution, the amount of a particular energy of light passing (transmitted) through that solution is quantified as transmittance. Transmittance is VISIBLE SPECTROSCOPY Revised 11/21/14 3 calculated by taking the ratio of the intensity (amount) of light leaving the chemical sample (I) to the intensity (amount) of light entering the chemical sample (Io). (Figure 3) I0II0: Incident Light(light entering sample)I: Transmitted Light(light leaving sample)colored solutioncuvette Figure 3. Transmittance (T = I/I0) of Light by a Sample Absorbance (A) (the amount of light absorbed by the chemical sample) is calculated from the transmittance (2): (2) A = log (1/T) = log T or A = log %T Absorbances are measured by an instrument called a spectrophotometer or spectrometer.
7 A spectrometer contains a light source, focusing lenses, a diffraction grating or prism to split light into different wavelengths, a sample holder or "cell", a photosensitive detector which measures the light passing through the sample, an amplifier, and an output device such as a meter or recorder. The solution to be analyzed is poured into a special vessel called a cuvette. A cuvette is a rectangular box with two opposing clear walls. Typically, two cuvettes are used when measuring a sample. One contains the blank (typically, the solvent only) and the other contains the sample dissolved in the same solvent.
8 To prevent spilling and insure a good measurement, fill a cuvette with solution to about 75% of its total volume. Wipe the outside of a cuvette with a tissue before placing it in the sample holder. Beads of water, fingerprints, or bubbles in the solution interfere with transmission of light through the sample. Gently insert a cuvette into the sample holder so that the light passes VISIBLE SPECTROSCOPY Revised 11/21/14 4 through its opposing clear smooth walls (take care not to spill solutions into the spectrometer). Replace scratched cuvettes. Absorption Spectrum The absorption spectrum is a plot of the absorbance of a sample as a function of wavelength.
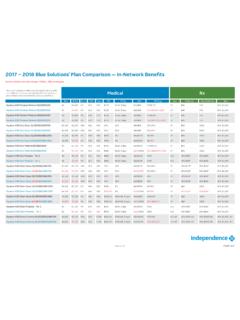
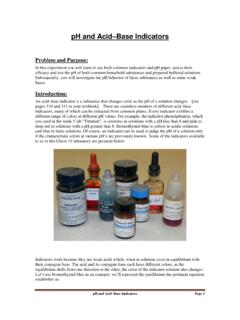
9 This plot can be used to help identify an unknown sample since some compounds have characteristic absorption spectra. Figure 6 shows the absorbance spectrum in the VISIBLE region for a complex metal ion. Maximum absorption for this ion occurs at a wavelength of approx. 560 nm. Figure 6: A Plot of Absorbance vs. Wavelength for a Metal Ion Complex Beer's Law Plot For dilute solutions , the amount of light absorbed at a specific wavelength is directly proportional to the concentration of the solution. This relationship is called Beer's Law (3). (3) A = C l A = absorbance (no units) = molar absorptivity coefficient (units = L/mol-cm) C = concentration of absorbing species (units = mol/L) l = path length (units = cm) VISIBLE SPECTROSCOPY Revised 11/21/14 5 A Beer s Law Plot is a calibration curve of absorption plotted as a function of concentration.
10 An absorption spectrum must be acquired first to determine the wavelength of maximum absorbance, max, for the compound being studied. All absorbances are acquired at this wavelength setting because the signal is the strongest and least likely to be obscured by instrument fluctuations. To create the plot, the absorbances of at least three solutions of known concentration are measured. A graph of absorbance versus concentration is constructed and a best fit straight line is drawn through the data points. Then the absorbance of a solution of unknown concentration is measured and its concentration is determined by comparison to the Beer's Law Plot.