Transcription of A Beer’s Law Experiment Introduction
1 6A beer s Law Experiment Introduction There are many ways to determine concentrations of a substance in solution. So far, the only experiences you may have are acid-base titrations or possibly determining the pH of a solution to find the concentration of hydrogen ion. There are other properties of a solution that change with concentration such as density, conductivity and color. beer s law relates color intensity and concentration. Using color can be much faster than doing a titration, especially when you have many samples containing different concentrations of the same substance, but the tradeoff is the time required to make a calibration curve.
2 When colored solutions are irradiated with white light, they will selectively absorb light of some wavelengths, but not of others. This is because of the relationship between the electrons in a molecule (or atom) and its energy. Electrons in molecules and atoms are restricted in energy; occupying only certain fixed (for any given atom or molecule) energy levels. The electrons in molecules can jump up in energy levels if exactly the right amount of energy is supplied. This amount of energy can be provided by electromagnetic radiation. Visible light is one form of electromagnetic radiation. When this happens, the particular energy of light, which corresponds to a particular wavelength or color, is absorbed and disappears.
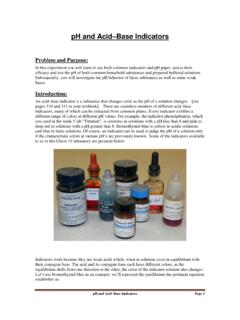
3 The remaining light, lacking this color, shows the remaining mixture of colors as non-white light. A color wheel, shown below, illustrates the approximate complementary relationship between the wavelengths of light absorbed and the wavelengths transmitted. For example, in a blue substance, there would be a strong absorbance of the complementary (opposite it in the color wheel) color of light, orange. When light is not absorbed, it is said that the light is transmitted through the solution. The more light a solution absorbs, the less light is transmitted through the solution. The wavelength or 7group of wavelengths when a solution absorbs light can be determined by exposing the solution to monochromatic light of different wavelengths and recording the responses.
4 Light original <____> transmitted source intensity pathlength intensity If light of a particular wavelength in not absorbed, the intensity of the beam directed at the solution (Io) would match the intensity of the beam transmitted by the solution (It). If some of the light is absorbed, the intensity of the beam transmitted through the solution will be less than that of the original intensity. The ratio of It and Io can be used to indicate the percentage of incoming light absorbed by the solution.
5 This is called the percent transmittance. toI%T = x 100I (1) A more useful quantity is the absorbance (A) defined as A = log(%T/100) (2) The higher the absorbance of light by a solution, the lower the percent transmittance. The wavelength at which absorbance is highest is the wavelength to which the solution is most sensitive to concentration changes. This wavelength is called the maximum wavelength or max. In the first part of this Experiment , you will determine max of one of the artificial food dyes by plotting absorbance versus wavelength.
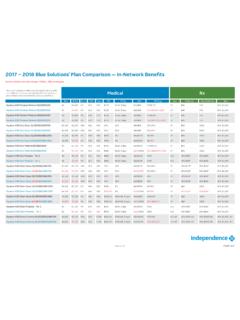
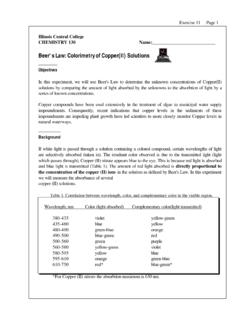
6 For an example of how this plot would look, refer to Figure I. By looking at Figure I, it can be determined that max for a purple dye is approximately at 570 nm. Once you determine max, you can demonstrate how three variables influence the absorbance of a solution. They are the concentration (c) of the solution, the pathlength (b) of the light through the solution (also called the cell length) and the molar absorptivity ( ); the sensitivity of the absorbing species to the energy of max. The pathlength, unless stated otherwise, is fixed at cm. The molar absorptivity depends on the substance, the solvent and.
7 The units for molar absorptivity are L/mole cm for concentration in mole/L. beer s law states the following: A = bc (3) With this equation (a calibration curve based on it), you can determine an unknown concentration or estimate what the absorbance of a certain solution will be as long as three of the four values in the equation are known. 8In the second part of this Experiment , you will determine the molar absorptivity of the dye chosen in the first part in aqueous solution. You will vary the concentration of your solution and make a calibration plot of absorbance versus concentration.
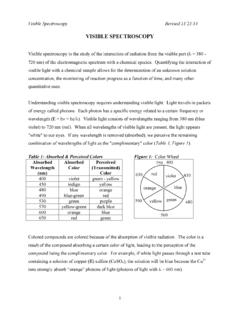
8 Absorbance is linearly related to concentration. To determine the molar absorptivity, take the slope of the line from the plot and divide by the pathlength. For an example of a calibration plot, refer to Figure II on page 12. It should be noted that there are conditions where deviations from beer s law occur. This happens when concentrations are too high or because of lack of sensitivity of instrumentation. In the third part of the Experiment , you will determine the mass percent of your chosen dye in a consumable product sample. Currently only seven non-natural compounds are certifiable for use in food in the United States. The structures and formulae are given below.
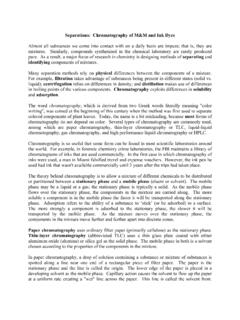
9 Dye Common name Chemical Formula Color Red #3 Erythrosine Na2C20H6I4O5 Cherry red OIINa+ -OIICOO- Na+O Red #40 Allura Red AC Na2C18H14N2O8S2 Orange-red NNOHOCH3CH3Na+ -SO3SO3- Na+ blue #1 Brilliant blue FCF Na2C37H34N2O9S3 Bright blue NNSO3-SO3- Na+SO3- Na++ blue #2 Indigotine Na2C16H8N2O8S2 Royal blue NNOOSO3- Na+Na+ -O3 SHH Yellow #5 Tartrazine Na3C16H9N4O9S2 Lemon yellow NNa+ -O3 SNNNSO3- Na+OHCOO- Na+ 9 Yellow #6 Sunset Yellow Na2C16H10N2O7S2 Orange NNOHNa+ -SO3SO3- Na+ Green #3 Fast Green FCF Na2C37H34N2O10S3 Sea green +NNSO3-SO3- Na+SO3- Na+HO You will accurately weigh
10 A sample containing a dye, extract the dye to make a solution and measure its absorbance. Using the calibration curve you obtained in the second part, you can determine the concentration of the dye from the graph. Figure I: Absorbance versus wavelength plot to determine max. Absorbance of Purple Dye versus (nm)Absorbance 10 Figure II: Example of a calibration curve. Line should go through the point 0,0. At M concentration, the absorbance is calibrated to be zero. This will almost always be one of your points. The slope of the line is and R2 gives the fit (should be 1). Calibration Curve of Purple Dye at 572 nmy = x 103xR2 = + (M)Absorbance Procedure Part I 1.