Transcription of Water Demand Analysis - Newport, Oregon
1 Civil West Engineering Services, Inc. 6-1 Water Demand Analysis Existing Water Use Definitions System Water Demand is the quantity of Water that the treatment plant must produce in order to meet all Water needs in the community. Water Demand includes Water delivered to the system to meet the needs of consumers, Water supply for fire fighting and system flushing, and Water required to properly operate the treatment facilities. Additionally, virtually all systems have a certain amount of leakage that cannot be economically removed and thus total Demand typically includes some leakage. The difference between the amount of Water sold and the amount delivered to the system is referred to as unaccounted Water .
2 Unaccounted Water can result from system flushing, leakage, fire fighting, meter inaccuracies, and other non-metered usage. Water Demand varies seasonally with the lowest usage in winter months and the highest usage during summer months. Variations in Demand also occur with respect to time of day. Diurnal peaks typically occur during the morning and early evening periods, while the lowest usage occurs during nighttime hours. The objective of this section is to determine the current Water Demand characteristics and to project future Demand requirements that will establish system component adequacy and sizing needs. Water Demand is described in the following terms: Average Annual Demand (AAD) - The total volume of Water delivered to the system in a full year expressed in gallons.
3 When Demand fluctuates up and down over several years, an average is used. Average Daily Demand (ADD) - The total volume of Water delivered to the system over a year divided by 365 days. The average use in a single day expressed in gallons per day. Maximum Month Demand (MMD) - The gallons per day average during the month with the highest Water Demand . The highest monthly usage typically occurs during a summer month. Peak Weekly Demand (PWD) - The greatest 7-day average Demand that occurs in a year expressed in gallons per day. Maximum Day Demand (MDD) - The largest volume of Water delivered to the system in a single day expressed in gallons per day.
4 The Water supply , treatment plant and transmission lines should be designed to handle the maximum day Demand . Peak Hourly Demand (PHD) - The maximum volume of Water delivered to the system in a single hour expressed in gallons per day. Distribution systems should be designed to adequately handle the peak hourly Demand or maximum day Demand plus fire flows, whichever is greater. During peak hourly flows, storage reservoirs supply the Demand in excess of the maximum day Demand . Demands described above, expressed in gallons per day (gpd), can be divided by the population or Equivalent Dwelling Units (EDUs) served to come up with a Demand per person or per capita which is expressed in gallons per capita per day (gpcd), or Demand per EDU (gpd/EDU).
5 These unit demands can be multiplied by future population or EDU projections to estimate future Water demands for planning purposes. Section 6 City of Newport Water Demand Analysis Water System Master Plan 6-2 Civil West Engineering Services, Inc. Existing Water Demand Existing Water Demand in Newport has been determined from daily plant operational records from 2004 through 2007. At the Newport Water treatment plant, Water Demand records include quantities of Water pumped into the distribution system plus Water used for plant operations; primarily filter backwashing. On average 95% of the Water treated is sent into the distribution system while 5% is used for plant operation.
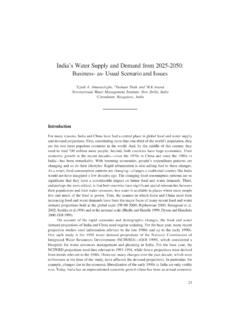
6 Daily Water production ( Water pumped to system plus backwash Water ) for the period of record is shown below. 1/1/20041/31/20043/1/20044/1/20045/1/200 46/1/20047/1/20047/31/20048/31/20049/30/ 200410/31/200411/30/200412/31/20041/30/2 0053/1/20054/1/20055/1/20056/1/20057/1/2 0057/31/20058/31/20059/30/200510/31/2005 11/30/200512/31/20051/30/20063/1/20064/1 /20065/1/20066/1/20067/1/20067/31/20068/ 31/20069/30/200610/31/200611/30/200612/3 1/20061/30/20073/1/20074/1/20075/1/20076 /1/20077/1/20077/31/20078/31/20079/30/20 0710/31/200711/30/200712/31/20071/30/200 82/29/20083/31/2008 Flow (MGD)DateNewport WTP2004-2007 Water ProductionAAD = 785 MGADD = MGDMMD = MGDMDD = MGDF igure Daily Water Production, 2004-2007 Total annual Demand has ranged from 776 to 795 million gallons with an average (AAD) of 785 million gallons.
7 Peaks occur in the summer (June, July, August) as is typical for most communities. Maximum month flows ranged from 100 to 117 million gallons per month, always in July, resulting in a MMD range of to mgd. The average daily Demand (ADD) for the period is mgd. The measured maximum day demands ranged from to mgd however these peaks are not representative of the true MDD as discussed below. For the last several years the Water treatment plant has operated at full capacity during peak summer Demand periods but sometimes is unable to produce enough Water to keep up with use in the system. During these times the plant runs virtually 24 hours per day while Water levels in the distribution system storage tanks continue to drop.
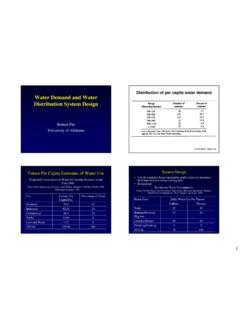
8 The plant should be able to meet maximum daily needs while keeping system storage full with only peak hourly demands or fire demands causing the storage levels to drop temporarily. This situation prevents the true maximum daily Demand (MDD) from being measured. As can be seen in the graphical representations of plant data in Figures through , summer peaks of the annual Demand curves are truncated where plant capacity is reached near 24 hour run times. To determine actual MDD flows storage tank levels were evaluated during peak days to measure volume demanded by the system in excess of plant output. On the peak days measured in 2004 and 2006, storage levels dropped by 61,100 gallons and 235,000 gallons respectively.
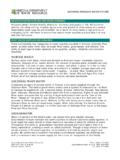
9 Plant output was sufficient to maintain tank levels in 2005 and 2007. These storage tank volume reductions are added to the measured plant output to estimate the actual current MDD at mgd. City of Newport Section 6 Water System Master Plan Water Demand Analysis Civil West Engineering Services, Inc. 6-3 (MGD)Run HoursDate2006 WTP RecordsWater Produced and Run TimeRun HoursWater TreatedTruncated Peak Figure Plant Run Hours and Daily Production, 2006 1/1/20041/31/20043/1/20044/1/20045/1/200 46/1/20047/1/20047/31/20048/31/20049/30/ 200410/31/200411/30/2004 Flow (MG)DateNewport WTP2004 ProductionRAWTREATEDT otal = MGADD = MGDMMD = MGDMDD = MGD (Measured)MDD = MGD (Actual)
10 Measured MDD truncated due to plant capacity limitationsTreatedincludes recycle Water plus raw Water Figure 2004 WTP Production Section 6 City of Newport Water Demand Analysis Water System Master Plan 6-4 Civil West Engineering Services, Inc. (MG)DateNewport WTP2005 Flow RecordsRAWTREATEDRECYCLET otal = MGADD = MGDMMD = MGDMDD = MGD (Measured) Figure 2005 WTP Production (MG)DateNewport WTP2006 Flow RecordsRAWTREATEDRECYCLET otal = MGADD = MGDMMD = MGDMDD = MGD (Measured)MDD = MGD (Actual)Measured MDD truncated due to plant capacity limitations City of Newport Section 6 Water System Master Plan Water Demand Analysis Civil West Engineering Services, Inc.