Transcription of Wells Fargo Reports Fourth Quarter 2021 Net Income of $5.8 ...
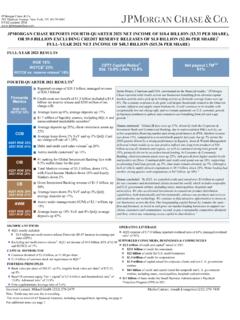
1 News Release | January 14, 2022 Wells Fargo Reports Fourth Quarter 2021 Net Income of $ billion, or $ per Diluted Share Full Year 2021 Net Income of $ billion, or $ per Diluted Share Company-wide Financial Summary Operating Segments and Other Highlights Quarter ended Quarter Dec 31, 2021 Selected Income Statement Data Dec 31, 2021 Dec 31, 2020 ($ in billions) ended Dec 31, 2021 % Change from Sep 30,Dec 31, 2021 2020 ($ in millions except per share amounts) Average loans Total revenue $ 20,856 18,489 Consumer Banking and Lending $ % (13) Noninterest expense 13,198 14,802 Commercial Banking 3 (3) Provision for credit losses Net Income (452) 5,750 (179) 3,091 Corporate and InvestmentBanking Wealth and Investment 6 13 Diluted earnings per common share Management 1 5 Selected Balance Sheet Data Average deposits ($ in billions) Consumer Banking and Lending 2 13 Average loans $ Commercial Banking 4 12 Average deposits CET111, 1, Corporate and InvestmentBanking Wealth and Investment (4)(12)Performance Metrics Management 2 7 Capital Repurchased million shares, or $ billion, ofcommon stock in Fourth Quarter 2021 Fourth Quarter 2021 results included.
2 $943 million, or $ per share, net gain on the sales of our Corporate Trust Services (CTS) business and Wells FargoAsset Management (WFAM) $875 million, or $ per share, decrease in the allowance for credit losses ($268) million, or ($ ) per share, impairment of certain leased rail carsChief Executive Officer Charlie Scharf commented, As I look back on my slightly more than two years at Wells Fargo , I m incredibly proud of what our team has accomplished as we remake this incredible franchise. We have made sweeping changes to the leadership and culture, made significant progress on our risk, regulatory, and control work, improved the efficiency of the company while investing in our business in a more holistic and aggressive way, and have taken a different approach to our customer- and community-facing responsibilities as a large public company.
3 And those on the front lines have worked fearlessly and tirelessly to support our customers through incredibly difficult circumstances. In 2021, we improved our financial returns, including reducing our expenses and returning a significant amount of excess capital to our shareholders by increasing our dividend and repurchasing $ billion of common stock. We also had strong deposit growth and while loan demand was weak early in the year, loans grew 5% in the second half with growth in both our consumer and commercial portfolios. As the economy continued to recover we saw increased consumer spending, higher investment banking fees, higher asset-based fees in our Wealth and Investment Management business, and strong equity gains in our affiliated venture capital and private equity businesses.
4 We continued to manage credit well and the strong economic environment helped reduce charge-offs to historical lows and our results benefitted from reductions in our allowance for credit losses, Scharf added. The changes we ve made to the company and continued strong economic growth prospects make us feel good about how we are positioned entering 2022. But we also remain cognizant that we still have a multiyear effort to satisfy our regulatory requirements with setbacks likely to continue along the way and we continue our work to put exposures related to our historical practices behind us, Scharf continued. As we look forward, we will continue to be aggressive in driving progress and improvement in our performance, embrace our responsibility to our customers and communities, and I remain incredibly optimistic about our future, Scharf concluded.
5 1 Represents our Common Equity Tier 1 (CET1) ratio calculated under the Standardized Approach, which is our binding CET1 ratio. See tables on pages 27-28 of the 4Q21 Quarterly Supplement for more information on CET1. CET1 for December 31, 2021, is a preliminary estimate. 2 Return on equity (ROE) represents Wells Fargo net Income applicable to common stock divided by average common stockholders equity. 3 Tangible common equity and return on average tangible common equity (ROTCE) are non-GAAP financial measures. For additional information, including a corresponding reconciliation to GAAP financial measures, see the Tangible Common Equity tables on pages 25-26 of the 4Q21 Quarterly Supplement.
6 Financial results reported in this document are preliminary. Final financial results and other disclosures will be reported in our Annual Report on Form 10-K for the year ended December 31, 2021, and may differ materially from the results and disclosures in this document due to, among other things, the completion of final review procedures, the occurrence of subsequent events, or the discovery of additional information. Selected Company-wide Financial Information Earnings ($ in millions except per share amounts) Net interest Income Noninterest Income Total revenue Net charge-offs Change in the allowance for credit losses Provision for credit losses Noninterest expense Income tax expense (benefit) Wells Fargo net Income Diluted earnings per common share $ $ Dec 31, 2021 9,262 11,594 20,856 423 (875) (452) 13,198 1,711 5,750 Quarter ended Sep 30,Dec 31, 2021 2020 8,909 9,355 9,925 9,134 18,834 18,489 257 584 (1,652) (763) (1,395) (179) 13,303 14,802 1,521 574 5,122 3,091 Dec 31, 2021 % Change from Sep 30,Dec 31, 2021 2020 4 % (1) 17 27 11 13 65 (28) 47 (15) 68 NM (1) (11) 12 198 12 86 18 109 $ $ Dec 31, 2021 35,779 42,713 78,492 1,582 (5,737)
7 (4,155) 53,831 5,578 21,548 Year ended Dec 31, 2020 39,956 34,308 74,264 3,370 10,759 14,129 57,630 (1,157) 3,377 Balance Sheet Data (average) ($ in billions) Loans Deposits Assets $ 1, 1, 1, 1, 1, 1, 2 1 (3) 7 1 $ 1, 1, 1, 1, Financial Ratios Return on assets (ROA) Return on equity (ROE) Return on average tangible common equity(ROTCE) (a) Efficiency ratio (b) Net interest margin on a taxable-equivalent basis % 63 71 80 % 69 78 NM Not meaningful (a) Tangible common equity and return on average tangible common equity are non-GAAP financial measures. For additional information, including a corresponding reconciliation to GAAP financial measures, see the Tangible Common Equity tables on pages 25-26 of the 4Q21 Quarterly Supplement.
8 (b) The efficiency ratio is noninterest expense divided by total revenue (net interest Income and noninterest Income ). Fourth Quarter 2021 vs. Fourth Quarter 2020 Net interest Income decreased 1%, primarily due to the impact of lower yields on earning assets and lower loan balances reflecting soft demand and elevated prepayments, largely offset by a decrease in long-term debt, lower mortgage-backed securities premium amortization, and higher interest Income from loans purchased from securitization pools and Paycheck Protection Program (PPP) loans Noninterest Income increased 27%, driven by strong results in our affiliated venture capital and private equity businesses, and net gains from the sales of divested businesses. In addition, investment banking fees improved on higher debt underwriting and advisory fees, and card and deposit-related fees increased.
9 These increases were partially offset by impairment of certain leased rail cars, lower mortgage banking Income primarily due to lower gain on sale margins and lower originations, and lower trading activity in spread products Noninterest expense decreased 11%, driven by efficiency initiatives that drove lower personnel expense, consultant spend, and occupancy expense, as well as lower restructuring charges and operating losses Provision for credit losses in Fourth Quarter 2021 included an $875 million decrease in the allowance for credit losses due to continued improvements in the economic environment, as well as a decrease in net charge-offs -2.
10 Selected Company-wide Capital and Liquidity Information ($ in billions) Capital: Total equity Common stockholders equity Tangible common equity (a) Common Equity Tier 1 (CET1) ratio (b) Total loss absorbing capacity (TLAC) ratio (c) Supplementary Leverage Ratio (SLR) (d) $ Dec 31, 2021 % Quarter ended Sep 30,Dec 31, 2021 2020 Liquidity: Liquidity Coverage Ratio (LCR) (e) 118 119 133 (a) Tangible common equity and return on average tangible common equity are non-GAAP financial measures. For additional information, including a corresponding reconciliation to GAAP financial measures, see the Tangible Common Equity tables on pages 25-26 of the 4Q21 Quarterly Supplement. (b) Represents our CET1 ratio calculated under the Standardized Approach, which is our binding CET1 ratio.
