Example: quiz answers
What is FT IR? - Northwestern University
Infrared (IR) spectroscopy is a chemical analytical technique, which measures the infrared intensity versus wavelength (wavenumber) of light. Based upon the wavenumber, infrared light can be categorized as far infrared (4 ~ 400cm‐1), mid infrared (400 ~ 4,000cm‐1) and near
Tags:
Information
Domain:
Source:
Link to this page:
Documents from same domain
How to prepare IR samples? - NUANCE Center
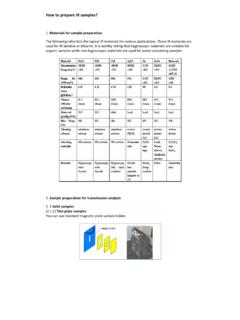
www.nuance.northwestern.eduHow to prepare IR samples? 1. Materials for sample preparation The following table lists the typical IR materials for various applications.

Tuschel Career Biography Molecular Spectroscopy …
www.nuance.northwestern.eduTuschel Career Biography . David Tuschel is currently the Manager of Raman Applications at HORIBA Scientific. In this capacity he manages support of customers in applied Raman spectroscopy.
LabRAM HR - NUANCE Center
www.nuance.northwestern.eduRaman Spectroscopy Systems LabRAM HR Spectroscopy Suite Powered by: Cutting-Edge Applications with the LabRAM HR Pharmaceuticals ... Deeply involved in Raman spectroscopy for decades, HORIBA Scientific has been providing an extensive array of Raman instruments for diverse applications.
Energy Dispersive X-ray Spectroscopy (EDS)
www.nuance.northwestern.eduEnergy Dispersive X-ray Spectroscopy (EDS) •Energy Dispersive X-ray Spectroscopy •Energy Dispersive X-ray Spectroscopy •Energy Dispersive Analysis of X-rays •Wavelength Dispersive X-ray Spectroscopy •Electrons in, X-rays out
Particle Analysis Using ImageJ - Northwestern University
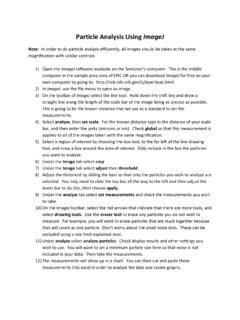
www.nuance.northwestern.eduParticle Analysis Using ImageJ Note: In order to do particle analysis efficiently, all images should be taken at the same magnification with similar contrast. 1) Open the ImageJ software available on the SemUser’s computer. This is the middle computer in the sample prep area of EPIC OR you can download ImageJ for free on your
Related documents

Seeking Light from the First Galaxies in the Universe NASA ...
www.jwst.nasa.govinstruments: Near-Infrared Camera (NIRCam), Near-Infrared Spectrograph (NIRSpec), Mid-Infrared Instrument (MIRI), and Near-Infrared Imager and Slitless Spectrograph (NIRISS) with the Fine Guidance Sensor (FGS) WAVELENGTHS: Visible, Near Infrared, Mid Infrared (0.6-28.5 micrometers) TRAVEL DISTANCE: 1 million miles

The Fundamentals of Infrared Spectroscopy
www.midac.comMid Infrared 4,500 to 400 cm-1 (2.5 to 50 μm) Far Infrared 400 to 12.5 cm-1 (50 to 800 μm) Using these units, visible light is from 0.36 to 0.75 μm, or 27,778 to 13,333 cm-1. There is a discussion of these units below. In the case of infrared spectroscopy, infrared light passes through a sample and certain
Fourier Transform Infrared Spectroscopy - Weebly
emanalhajji.weebly.comMar 13, 2016 · Fourier transform infrared spectroscopy (FTIR) is a method used to obtain an infrared spectrum of absorption or emission of a solid, liquid or gas. An FTIR spectrometer simultaneously collects high spectral resolution data over a wide spectral range. 1 Figure 1 shows the typical arrangement of FTIR.

Vibrational Spectroscopy (Infrared, IR-Spect.)
sci.tanta.edu.egVibrational (Infrared, IR) Spectroscopy • It is the technique which is used to identify chemical compounds based on how infrared radiations are absorbed by the compounds' chemical bonds, and interacts with them. ... Mid IR region - 2.5 to 50 μm (4000 – 200 cm-1) 3. Far IR region
How to prepare IR samples? - Northwestern University
www.nuance.northwestern.eduFor mid‐IR frequency range, KBr, KCl or diamond dust can be used. For far‐infrared testing, high‐density polyethylene (HDPE) or diamond dust is suitable. For near‐ infrared analysis, CsI or KBr can be selected. You can prepare a KBr Pellet as follows: ...
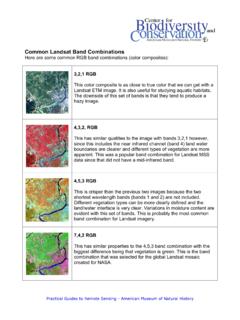
Common Landsat Band Combinations - Middlebury College
geography.middlebury.edu(1.55-1.75 µm, mid-infrared) This band is very sensitive to moisture and is therefore used to monitor vegetation and soil moisture. It is also good at differentiating between clouds and snow. Band 6 (10.40-12.50 µm, thermal infrared) This is a thermal band, which means it can be used to measure surface temperature.
Chapter 1 Infrared Detector Characterization
spie.orgdoes not include multiplexing functions in the infrared focal plane (IRFP). In the mid-1970s attention turned to the photodiodes for passive IR imaging applications. In contrast to photoconductors, photodiodes with their very low power dissipation, inherently high impedance, negligible 1/f noise, and easy
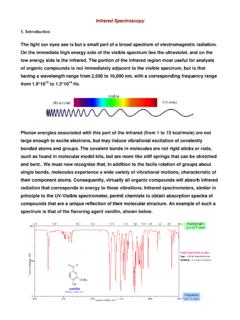
Infrared Spectroscopy 1. Introduction
www.ifsc.usp.brThe infrared portion of the electromagnetic spectrum is divided into three regions; the near-, mid- and far- infrared, named for their relation to the visible spectrum. The far-infrared, approximately 400-10 cm-1 (1000–30 μm), lying adjacent to the microwave region, has low energy and may be used for rotational spectroscopy.
Infrared and Raman Spectroscopy: Principles and Spectral ...
www.chemistry.uoc.grInfrared and Raman spectroscopy involve the study of the interaction of radiation with molecular vibrations but differs in the manner in which photon energy is transferred to the molecule by changing its vibrational state. IR spectroscopy measures transitions between molecular vibrational energy levels as a result of the absorption of mid-IR ...

New York Mid and Low Back Injury Medical Treatment ...
www.wcb.ny.govNew York Mid and Low Back Injury Medical Treatment Guidelines Second Edition, January 14, 2013 2 and implement effective educational strategies and skills.