
3. The Gaussian kernel - University of Wisconsin–Madison
This phenomenon, i.e. that a new function emerges that is similar to the constituting functions, is called self-similarity. The Gaussian is a self-similar function. ... Note that the squares of s add, not the s 's themselves. Of course we can concatenate as many blurring steps as we want to create a larger blurring step. With analogy to a ...
Download 3. The Gaussian kernel - University of Wisconsin–Madison
Information
Domain:
Source:
Link to this page:
Documents from same domain

P(Z Cumulative Probabilities of the Standard …
pages.stat.wisc.eduCumulative Probabilities of the Standard Normal Distribution N(0, 1) Left-sided area Left-sided area Left-sided area Left-sided area Left-sided area Left-sided area
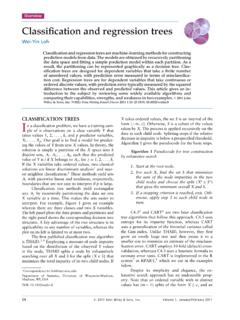
Classification and regression trees
pages.stat.wisc.eduOverview Classification and regression trees Wei-Yin Loh Classificationandregressiontreesaremachine-learningmethodsforconstructing predictionmodelsfromdata ...

BASIC CALCULUS REFRESHER - pages.stat.wisc.edu
pages.stat.wisc.edu3 y = x y = x2 Notice that the line has the generic equation y = f (x) = mx + b, where b is the Y-intercept (in this example, b = +3), and m is the slope of the line (in this example, m = +2). In general, the slope of any line is defined as the ratio of “height change” y to “length change” x, that is, m = y
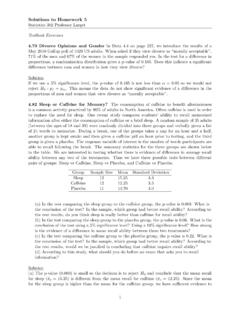
Solutions to Homework 5 Statistics 302 Professor Larget
pages.stat.wisc.eduSolutions to Homework 5 Statistics 302 Professor Larget Textbook Exercises 4.79 Divorce Opinions and Gender In Data 4.4 on page 227, we introduce the results of a May 2010 Gallup poll of 1029 US adults. When asked if they view divorce as \morally acceptable", 71% of the men and 67% of the women in the sample responded yes. In the test for a di ...
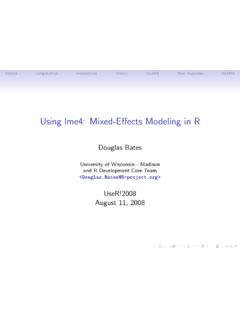
Using lme4: Mixed-Effects Modeling in R
pages.stat.wisc.eduDe nition of linear mixed-e ects models A mixed-e ects model incorporates two vector-valued random variables: the response, Y, and the random e ects, B. We observe the value, y, of Y. We do not observe the value of B. In a linear mixed-e ects model the conditional distribution, YjB, and the marginal distribution, B, are independent,
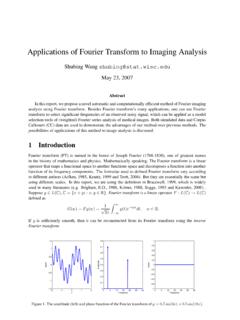
Applications of Fourier Transform to Imaging Analysis
pages.stat.wisc.eduCallosum (CC) data are used to demonstrate the advantages of our method over previous methods. The possibilities of applications of this method to image analysis is discussed. 1 Introduction Fourier transform (FT) is named in the honor of Joseph Fourier (1768-1830), one of greatest names in the history of mathematics and physics.
Solutions to Homework 1 Statistics 302 Professor Larget
pages.stat.wisc.eduselected. Other options are possible: for example, we could number the plants from 1 to 30000 and randomly select 30 numbers between 1 and 30000. (b) Answers will vary for this question, but the procedure should be explained and the three numbers which were obtained should be listed. Here is the start of one sample. Row Plant #94 #180 #83 # 81 ...

CHAPTER 8. RANDOMIZED COMPLETE BLOCK DESIGN …
pages.stat.wisc.eduMSEB is the mean square of design-B with degrees of freedom dfB. If RE>1, design A is more efficient. If RE<1, the converse is true. If a randomized complete block design (say, design-A) is used, one may want to estimate the relative efficiency compared with a completely randomized design (say, design-B).

Practice Exam Questions; Statistics 301; Professor Wardrop
pages.stat.wisc.edu13. A sample space has three possible outcomes, B, C, and D. It is known that P(C) = P(D). The operation of the chance mechanism is simulated 10,000 times (runs). The sorted frequencies of the three outcomes (B, C, and D) are: 2322, 2360, and 5318. (a) What is your approximation of P(B)? To receive credit you must explain your an-swer.

Power and Sample Size Determination
pages.stat.wisc.eduPower and Sample Size Determination Bret Hanlon and Bret Larget Department of Statistics University of Wisconsin|Madison November 3{8, 2011 Power 1 / 31 Experimental Design To this point in the semester, we have largely focused on methods to analyze the data that we have with little regard to the decisions on how to gather the data.
Related documents

How to configure alarm function of NVR Part 1 ...
www.hikvision.comStep 3: Click Menu>Camera, and then type in the parameters of IP cameras to them. Step 4: Click Configuration> Alarm to check the type of Alarm input. Please note: If the Alarm type is N.O (Normal open), a close alarm in will trigger this alarm. If …

Management Leading Function and Activities
pmworldlibrary.netthat function together to achieve a common purpose (“supersystem”) – e.g. air defence system Table 4-1: Two project dimensions and appropriate leadership styles – based on materials from Shenhar 1995 Different leadership styles are needed for different project life-cycle phases In the project context, Morris 2013:200 reports that

Excel Function - Full List - Western Sydney
www.westernsydney.edu.auCALL function Add-in and Automation: Calls a procedure in a dynamic link library or code resource CEILING function Math and trigonometry: Rounds a number to the nearest integer or to the nearest multiple of significance CELL function Information: Returns information about the formatting, location, or