BASIC CALCULUS REFRESHER
p = 1, the graph is the straight line y = x. And if 0 < p < 1, then the graph is concave down, such as the parabola y = x1/2 = x.) However, if p < 0, such as y = x 1 = 1 x, or y = x 2 = 1 x2, then the Y-axis acts as a vertical asymptote for the graph, and the X-axis is a horizontal asymptote. Exercise: Why is y = xx not a power function? Sketch ...
Download BASIC CALCULUS REFRESHER

Information
Domain:
Source:
Link to this page:
Documents from same domain
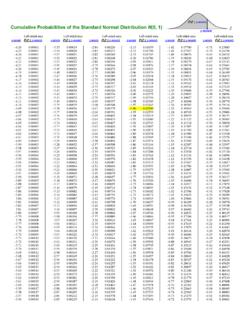
P(Z Cumulative Probabilities of the Standard …
pages.stat.wisc.eduCumulative Probabilities of the Standard Normal Distribution N(0, 1) Left-sided area Left-sided area Left-sided area Left-sided area Left-sided area Left-sided area
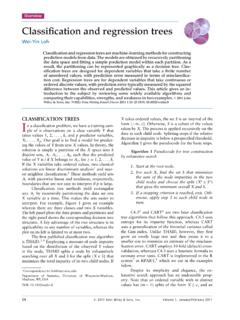
Classification and regression trees
pages.stat.wisc.eduOverview Classification and regression trees Wei-Yin Loh Classificationandregressiontreesaremachine-learningmethodsforconstructing predictionmodelsfromdata ...
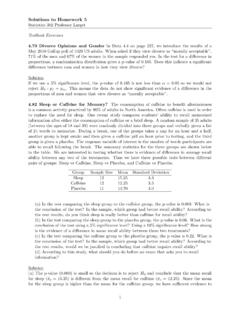
Solutions to Homework 5 Statistics 302 Professor Larget
pages.stat.wisc.eduSolutions to Homework 5 Statistics 302 Professor Larget Textbook Exercises 4.79 Divorce Opinions and Gender In Data 4.4 on page 227, we introduce the results of a May 2010 Gallup poll of 1029 US adults. When asked if they view divorce as \morally acceptable", 71% of the men and 67% of the women in the sample responded yes. In the test for a di ...
Using lme4: Mixed-Effects Modeling in R
pages.stat.wisc.eduDe nition of linear mixed-e ects models A mixed-e ects model incorporates two vector-valued random variables: the response, Y, and the random e ects, B. We observe the value, y, of Y. We do not observe the value of B. In a linear mixed-e ects model the conditional distribution, YjB, and the marginal distribution, B, are independent,
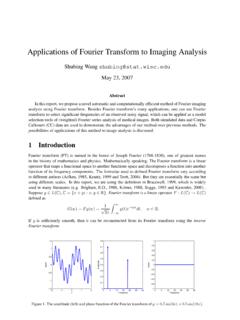
Applications of Fourier Transform to Imaging Analysis
pages.stat.wisc.eduCallosum (CC) data are used to demonstrate the advantages of our method over previous methods. The possibilities of applications of this method to image analysis is discussed. 1 Introduction Fourier transform (FT) is named in the honor of Joseph Fourier (1768-1830), one of greatest names in the history of mathematics and physics.
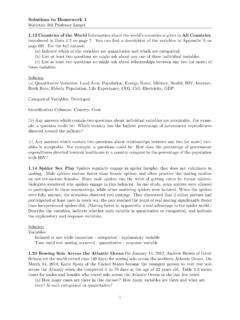
Solutions to Homework 1 Statistics 302 Professor Larget
pages.stat.wisc.eduselected. Other options are possible: for example, we could number the plants from 1 to 30000 and randomly select 30 numbers between 1 and 30000. (b) Answers will vary for this question, but the procedure should be explained and the three numbers which were obtained should be listed. Here is the start of one sample. Row Plant #94 #180 #83 # 81 ...
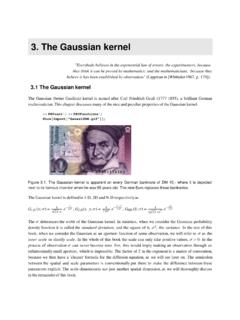
3. The Gaussian kernel
pages.stat.wisc.eduThe Gaussian kernel is defined in 1-D, 2D and N-D respectively as ... process of observation s can never become zero. For, this would imply making an observation through an infinitesimally small aperture, which is impossible. The factor of 2 in the exponent is a matter of convention,
CHAPTER 8. RANDOMIZED COMPLETE BLOCK DESIGN …
pages.stat.wisc.eduMSEB is the mean square of design-B with degrees of freedom dfB. If RE>1, design A is more efficient. If RE<1, the converse is true. If a randomized complete block design (say, design-A) is used, one may want to estimate the relative efficiency compared with a completely randomized design (say, design-B).
Practice Exam Questions; Statistics 301; Professor Wardrop
pages.stat.wisc.edu13. A sample space has three possible outcomes, B, C, and D. It is known that P(C) = P(D). The operation of the chance mechanism is simulated 10,000 times (runs). The sorted frequencies of the three outcomes (B, C, and D) are: 2322, 2360, and 5318. (a) What is your approximation of P(B)? To receive credit you must explain your an-swer.
Power and Sample Size Determination
pages.stat.wisc.eduPower and Sample Size Determination Bret Hanlon and Bret Larget Department of Statistics University of Wisconsin|Madison November 3{8, 2011 Power 1 / 31 Experimental Design To this point in the semester, we have largely focused on methods to analyze the data that we have with little regard to the decisions on how to gather the data.
Related documents

Unit 9 Describing Relationships in Scatter Plots and Line ...
lycofs01.lycoming.eduThe line graph is popular as a visual display to trace how the value of a variable changes through time. Figure 9-3 is a line graph displaying the change over time in the prices of Table 9-1, and Figure 9-4 is a line
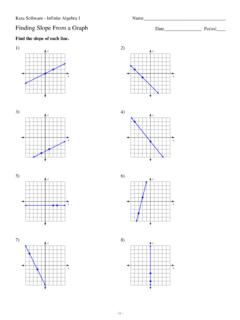
Slope From a Graph.ks-ia1
cdn.kutasoftware.comFind the slope of each line. 1) x y 2) x y 3) x y 4) x y 5) x y 6) x y 7) x y 8) x y-1-©r B2N0w1y2 D nK ru0thay gS SoYf1tPwLasr meq aL4L1Cs. i 2 bA NlblG Trti bgghFtCsd zr vevs se Pr wvreidp. f 9 ZMca sd0e R 2wHist 9hf 8Ian EfDitn 5ibtke c UAvlxg oeUb8r3a W o1 R.q Worksheet by Kuta Software LLC ... Slope From a Graph.ks-ia1
LEARNWELL OY
www.ilc.cuhk.edu.hk• Don’t write about everything on the graph. Pick the biggest, the smallest, the main points, the main trends. Group similar things together • Don’t write about the line or the bar: “The line went up,” “The bar went down.” Instead, write about the idea. “The number of people going to …

How to create graphs with a “best fit line” in Excel
www.utsa.eduHow to create graphs with a “best fit line” in Excel . 2In this manual, we will use two examples: y = x, a linear graph; and y = x, a non-linear graph. The y-values were specifically chosen to be inexact to illustrate what you will see when you analyze data from your labs.
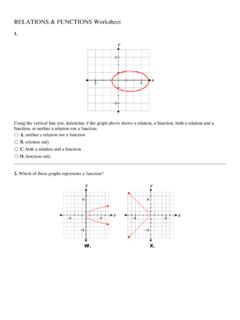
RELATIONS & FUNCTIONS Worksheet
8theastviewmath.weebly.comThe graph does not pass the vertical line test; therefore, the graph is not a function, and it is a relation only. 2. Use the vertical line test to determine if the graphs represent a function. The only graph given that passes the vertical line test is Y. 3. A function maps each domain element to only one range element.
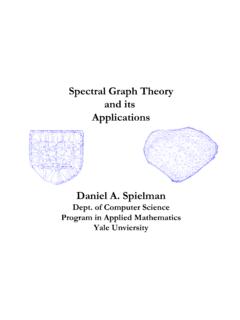
Spectral Graph Theory and its Applications
www.cs.yale.eduSpectral graph drawing: Tutte justification Gives for all i λsmall says x(i) near average of neighbors Tutte ‘63: If fix outside face, and let every other vertex be average of neighbors, get planar embedding of planar graph.

Table of ConTenTs
nces.ed.govLine graphs can be used to show how something changes over time. Line graphs are good for plotting data that has peaks (ups) and valleys (downs), or that was collected in a short time pe-riod. The following pages describe the different parts of a line graph. the titLe The title offers a short explanation of what is in your graph.
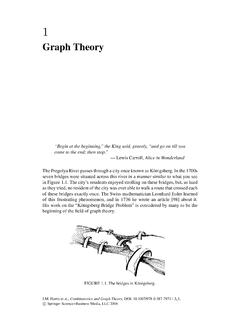
Graph Theory
www3.nd.eduThe vertex set of a graph G is denoted by V(G), and the edge set is denoted by E(G). We may refer to these sets simply as V and E if the context makes the particular graph clear. For notational convenience,instead of representingan edge as {u,v }, we denote this simply by uv . The order of a graph G is the cardinality

Distance vs. Time Graph Worksheet
www.sfponline.org2) Draw a distance vs time graph of a dog that is tied to a 4 foot rope and travels in 1 complete circle 3) You leave Math class to walk to the nearest bathroom.