Bode Plot: Example 1 - utoledo.edu
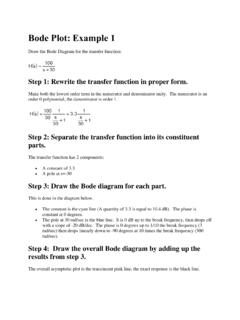
Step 2: Separate the transfer function into its constituent parts. The transfer function has 4 components: A constant of 0.1 A pole at s=-10 A pole at s=-100 A zero at s=-1 Step 3: Draw the Bode diagram for each part. This is done in the diagram below. The constant is the cyan line (A quantity of 0.1 is equal to -20 dB). The phase is constant at 0
Download Bode Plot: Example 1 - utoledo.edu

Information
Domain:
Source:
Link to this page:
Documents from same domain

Intrinsic safety 101 - UToledo Engineering
www.eng.utoledo.eduIntrinsic safety 101 Protection methods, containment, segregation, and prevention ... AUTOMATION BASICS a low-voltage signaling system that was used to ... physical principles of explosion protection are the same worldwide and are not differentiated,
Chapter 19 Programming the PID Algorithm
www.eng.utoledo.eduthe power F B that the pressure P 2 ... a controller setting has to be found that supplies a sufficiently fast and stable control result over the entire working range. ... Module Configuration, 4 Channel Module Wiring, and 4 Channel Module Specifications to find the choices available for Analog Inputs and Analog Outputs.
![CHAP. 7] BLOCK DIAGRAM ALGEBRA AND TRANSFER …](/cache/preview/5/5/8/8/1/3/4/c/thumb-5588134cce7b9b85f7cd5a0611a184e9.jpg)
CHAP. 7] BLOCK DIAGRAM ALGEBRA AND TRANSFER …
www.eng.utoledo.eduBLOCK DIAGRAM ALGEBRA AND TRANSFER FUNCTIONS OF SYSTEMS 161---t o2÷o0 Step 3:-t -R GIG4 '1 -- GIG4H1 Step 4: Does not apply. Step 5: I -- GIG4111 , Gs q- G3 1 -- GIG4HI Step 6: Does not apply. € An occasional requirement of block diagram reduction is the isolation of a particular block in a feedback or feedforward loop.
Chapter 7 TIMERS, COUNTERS and T/C APPLICATIONS
www.eng.utoledo.eduspecify whether the IEC timer is stored in its own data block (single instance) or as a local tag (multiple instance) in the block interface. ... P T P T Th e s e fig u re s s h o w p u ls e d ia g ra m s o f th e G e n e ra te O ff-De la y in s tru c tio n : Fig. 7-8 Off-Delay Timer Timing Diagrams . Ch 7 Timers, Counters, T/C Applications 8 ...

Chapter 15 HUMAN MACHINE INTERFACE - utoledo.edu
www.eng.utoledo.eduThe A-B product uses RSLinx Enterprise. This means that RSLinx Enterprise has the ability to allow this software package to browse directly for the tag database and link existing tags and not requiring a tag created in the HMI to complement the tag in the PLC. When starting a new application, select Objects from the main menu. Notice the types ...
CHAP. 7] BLOCK DIAGRAM ALGEBRA AND TRANSFER …
www.eng.utoledo.eduAlso, the transfer function of a single block is its output-to-input transform'. Hence (b) (c) This system has the same transfer function determined in part (a) because multiplication of transfer functions is commutative. By Equation (7..1), we have _,0 ,4 7.4. The transfer function of Fig. 7-14a is %/(s + too), whe.re too = 1/RC. Is the ...
Chapter 15 HUMAN MACHINE INTERFACE - eng.utoledo.edu
www.eng.utoledo.eduCh 15 Human Machine Interface 4 Fig. 15-7 A handheld thermocouple readout device with paper recording output Fig. 15-8 Several discrete controller devices for process control. Each device is capable of solving a single or multiple loops of process data executing a PID formula and controlling the output of the control loop.

Studio 5000 View Designer User Manual
www.eng.utoledo.eduWhat is the Alarm Manager? on page 105 In Alarm Manager updated the wording in the tip. Work with screenson page . 107 Updated maximum numbers of screens and popups for PanelView devices. Screen tab on . page 107 Create a screen on . page 108 Change the background color of a popup on . page 110 Updated steps in the task. Rename a screen
Chapter 19 Programming the PID Algorithm - utoledo.edu
www.eng.utoledo.educontrollers. However, as PLC prices continued to fall during the 1980’s and later and more ... SLC PID block followed by the CompactLogix processor as well as the Siemens 1200 and their ... Module Configuration, 4 Channel Module Wiring, and 4 Channel Module Specifications to find the choices available for Analog Inputs and Analog Outputs.
Bode Plot: Example 1 - utoledo.edu
www.eng.utoledo.eduStep 1: Rewrite the transfer function in proper form. Make both the lowest order term in the numerator and denominator unity. The numerator is an order 1 polynomial, the denominator is order 2. Step 2: Separate the transfer function into its constituent parts. The transfer function has 4 components: A constant of 0.1 A pole at s=-10
Related documents
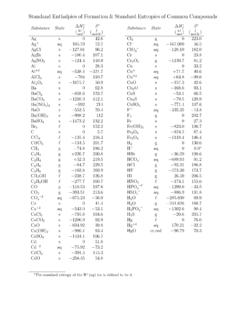
Standand Enthalpies of Formation & Standard Entropies of ...
www.mrbigler.comStandand Enthalpies of Formation & Standard Entropies of Common Compounds Substance State ∆H f S (kJmol) (Jmol·K) Ag s 0 42.6 Ag+ aq 105.79 72.7 AgCl s −127.01 96.2

STANDARD OPERATIONAL PROCEDURE FOR …
nac.edu.inand its constituent units shall be made by the designated purchasing officials only. 6.2 The purchasing official is empowered to act on the basis of an approved Expenditure Sanction or Indent. Sample pro forma for Expenditure Sanction and Indent as applicable to C.T.T.I are placed at Appendix A and Appendix B respectively.
STANDARD OPERATING PROCEDURE FOR STORES FUNCTION …
nac.edu.instandard operating procedure for stores function at nac and its constituent units, nac regional trg centres & out station trg centres n a t i o n a l a c a d e m y o f c o n s t r u c t i o n
INTRODUCTION À L'ÉTUDE DE LA FISCALITÉ
www.profiscal.combase de l’équité, constituent un devoir pour chaque personne. Au nombre des critiques et limites des différentes théories justificatives du prélèvement fiscal, on peut citer : § 1 - L'impôt, contrepartie des services de l'État : Cette conception qualifiée d'individualiste a évolué …

Immediate Constituent Analysis (ICA) - IJSRP
www.ijsrp.orgconstituent consists of only a word or meaningful part of a word. Approach of I.C. Analysis: The initial emphasis was upon pure segmentation, simply breakup the sentence into its constituent parts without, at first, knowing what these parts were: Generally the section is binary except in some cases where section into three or more points is ...

Recognition
www.npbea.orgAdministration) approved an ELCC (Educational Leadership Constituent Council) plan to revise the ELCC Standards for presentation to NCATE (National Council for the Accreditation of Teacher Education) in the fall of 2010. Two groups, a Technical Advisory Committee and a

Guidelines for the validation of analytical methods
apvma.gov.auconstituent and registration of an agricultural and veterinary chemical product, including those used in storage stability studies. They are not intended to apply to analytical methods for residue analysis, biological and biotechnological products. Approaches other than those set forth in this guideline may be

Waiver Form to Decline Health Care Coverage (00076189-3)
hr.unc.eduReturn the form to the Benefits Office: fax 919-962-6010 or CB 1045 {00076189.DOCX 3} Section 2 – To be completed by employee at time of hire or time of measurement if employee is determined to be eligible for health coverage. I currently work for another unit of UNC-CH and/or another constituent institution of The University of North Carolina (for a

Constituent Data Entry Guide - Blackbaud
www.blackbaud.comA constituent ID is a unique alpha‐numeric identifier assigned to every constituent record. These IDs can be manually assigned by you or automatically generated by TheRaiser’s Edge. Constituent record. A constituent record is a record that …