Bode Plot: Example 1 - utoledo.edu
The zeros give a dip in the magnitude plot of at a frequency of 5 rad/sec (because ζ is small, ω r≈ω 0). This is shown by the red circle. The phase goes from the low frequency asymptote (0 degrees) at to the high frequency asymptote at Again, because ζ …
Download Bode Plot: Example 1 - utoledo.edu

Information
Domain:
Source:
Link to this page:
Documents from same domain

Intrinsic safety 101 - UToledo Engineering
www.eng.utoledo.eduIntrinsic safety 101 Protection methods, containment, segregation, and prevention ... AUTOMATION BASICS a low-voltage signaling system that was used to ... physical principles of explosion protection are the same worldwide and are not differentiated,
Chapter 19 Programming the PID Algorithm
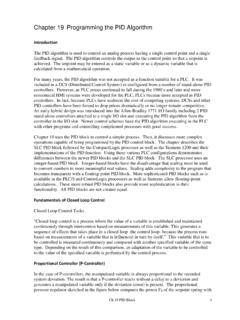
www.eng.utoledo.eduthe power F B that the pressure P 2 ... a controller setting has to be found that supplies a sufficiently fast and stable control result over the entire working range. ... Module Configuration, 4 Channel Module Wiring, and 4 Channel Module Specifications to find the choices available for Analog Inputs and Analog Outputs.
![CHAP. 7] BLOCK DIAGRAM ALGEBRA AND TRANSFER …](/cache/preview/5/5/8/8/1/3/4/c/thumb-5588134cce7b9b85f7cd5a0611a184e9.jpg)
CHAP. 7] BLOCK DIAGRAM ALGEBRA AND TRANSFER …
www.eng.utoledo.eduBLOCK DIAGRAM ALGEBRA AND TRANSFER FUNCTIONS OF SYSTEMS 161---t o2÷o0 Step 3:-t -R GIG4 '1 -- GIG4H1 Step 4: Does not apply. Step 5: I -- GIG4111 , Gs q- G3 1 -- GIG4HI Step 6: Does not apply. € An occasional requirement of block diagram reduction is the isolation of a particular block in a feedback or feedforward loop.
Chapter 7 TIMERS, COUNTERS and T/C APPLICATIONS
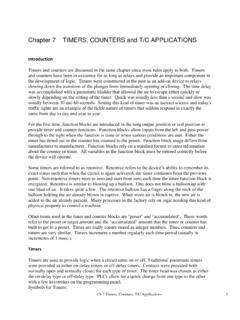
www.eng.utoledo.eduspecify whether the IEC timer is stored in its own data block (single instance) or as a local tag (multiple instance) in the block interface. ... P T P T Th e s e fig u re s s h o w p u ls e d ia g ra m s o f th e G e n e ra te O ff-De la y in s tru c tio n : Fig. 7-8 Off-Delay Timer Timing Diagrams . Ch 7 Timers, Counters, T/C Applications 8 ...

Chapter 15 HUMAN MACHINE INTERFACE - utoledo.edu
www.eng.utoledo.eduThe A-B product uses RSLinx Enterprise. This means that RSLinx Enterprise has the ability to allow this software package to browse directly for the tag database and link existing tags and not requiring a tag created in the HMI to complement the tag in the PLC. When starting a new application, select Objects from the main menu. Notice the types ...
Bode Plot: Example 1 - utoledo.edu
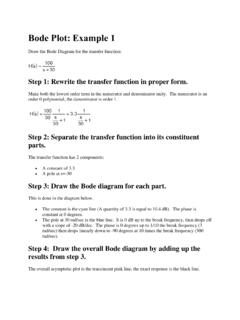
www.eng.utoledo.eduBode Plot: Example 1 Draw the Bode Diagram for the transfer function: Step 1: Rewrite the transfer function in proper form. Make both the lowest order term in the numerator and denominator unity. The numerator is an order 0 polynomial, the denominator is order 1. Step 2: Separate the transfer function into its constituent parts.
CHAP. 7] BLOCK DIAGRAM ALGEBRA AND TRANSFER …
www.eng.utoledo.eduAlso, the transfer function of a single block is its output-to-input transform'. Hence (b) (c) This system has the same transfer function determined in part (a) because multiplication of transfer functions is commutative. By Equation (7..1), we have _,0 ,4 7.4. The transfer function of Fig. 7-14a is %/(s + too), whe.re too = 1/RC. Is the ...
Chapter 15 HUMAN MACHINE INTERFACE - eng.utoledo.edu
www.eng.utoledo.eduCh 15 Human Machine Interface 4 Fig. 15-7 A handheld thermocouple readout device with paper recording output Fig. 15-8 Several discrete controller devices for process control. Each device is capable of solving a single or multiple loops of process data executing a PID formula and controlling the output of the control loop.

Studio 5000 View Designer User Manual
www.eng.utoledo.eduWhat is the Alarm Manager? on page 105 In Alarm Manager updated the wording in the tip. Work with screenson page . 107 Updated maximum numbers of screens and popups for PanelView devices. Screen tab on . page 107 Create a screen on . page 108 Change the background color of a popup on . page 110 Updated steps in the task. Rename a screen
Chapter 19 Programming the PID Algorithm - utoledo.edu
www.eng.utoledo.educontrollers. However, as PLC prices continued to fall during the 1980’s and later and more ... SLC PID block followed by the CompactLogix processor as well as the Siemens 1200 and their ... Module Configuration, 4 Channel Module Wiring, and 4 Channel Module Specifications to find the choices available for Analog Inputs and Analog Outputs.
Related documents

Republic of the Philippines Visayas Avenue, Diliman ...
mgb.gov.phan. "Small-Scale Mining Contractor" refers to small-scale miners organized as an individual miner or cooperative registered with the Securities and Exchange Commission (SEC) or with the appropriate government agency, which has entered into an agreement with the government for the small-scale utilization of a plot of mineral land within a People ...

Chapter 14. Enzyme Kinetics
personal.tcu.edu• If an enzyme has a small value of K M,it achieves maximal catalytic efficiency at low substrate concentrations • Measure of the enzyme’s binding affinity for the substrate (The lower K M, the higher affinity) K M = [S] at which v 0 = V max/2. Lineweaver-Burke plot
Map Accuracy Standards - USGS
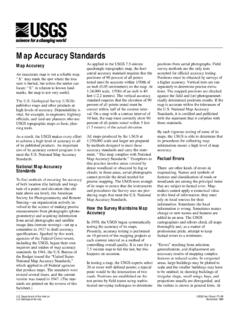
pubs.usgs.govirregular shape, small wings, bays, and projections usually are disregarded, and the outline is shown in general form. At Map Accuracy Standards U.S. Department of the Interior U.S. Geological Survey USGS Fact Sheet 171-99 November 1999
Customizing the Kaplan-Meier Survival Plot - SAS
support.sas.comEach example is designed to be small, simple, self-contained, and easy to copy and use “as is” or with minor modifications. Subsequent sections provide more details ... The plot inFigure 23.1consists of three step functions, one for each of the three groups of patients. The plot

Introduction to Small-Angle X-ray Scattering
www-ssrl.slac.stanford.eduPlot ln I 2against q →Straight line 0.002 0.004 0.006 0.008 q*q Ln (q) “The Guinier Plot” 2 0 i i I f ij ij N i j N j i qr qr Iq f q f q sin() () 1 Recall: thus i.e. the number of (excess) electrons in the sample 2 0 l a N V I c: concentration M: molecular mass V: Volume
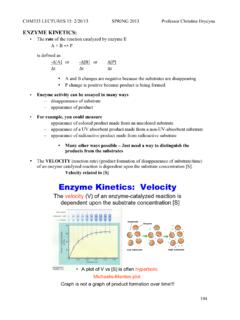
Enzyme Kinetics: Velocity - Purdue University
www.chem.purdue.edu• A plot of V vs [S] is often hyperbolic Michaelis-Menten plot Enzyme Kinetics: Velocity . ... • Small K m means tight binding; large K m means weak binding. CHM333 LECTURES 15: 2/20/13 SPRING 2013 Professor Christine Hrycyna 108 - Indicates how efficiently an enzyme selects its substrate and converts to product. ...

Maximum Range Explained range Figure 1: Trajectory Plot ...
www.physicsclassroom.comAnswers and Explanations: 1. Answer: C Explanation: The maximum range occurs for a launch angle of 45°. At this angle, the range is 163 meters - read from the graph in Figure 1 and listed in the fourth row of Table 1. 2. Answer: D Explanation: This answer can be determined by inspecting the trajectory plots in Figure 1 or the data in Table 1.There are five plots given in Figure 1 with …

Dystopias: Definition and Characteristics - ReadWriteThink
www.readwritethink.orgDystopias: Definition and Characteristics Utopia: A place, state, or condition that is ideally perfect in respect of politics, laws, customs, and conditions. Dystopia: A futuristic, imagined universe in which oppressive societal control and the illusion of a perfect society are maintained through corporate, bureaucratic,