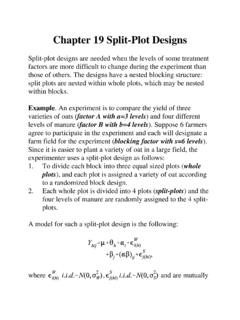
Chapter 19 Split-Plot Designs
Example of Split-Plot Design and Analysis: The Oats Experiment An experiment on the yield of three varieties (factor A) and four different levels of manure
Download Chapter 19 Split-Plot Designs

Information
Domain:
Source:
Link to this page:
Documents from same domain
Integre Technical Publishing Co., Inc. …
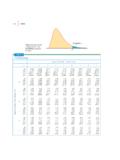
www.stat.purdue.eduTables • T-13 Table entry for p is the critical value F∗ with probability p lying to its right. F* Probability p TABLE E F critical values (continued) Degrees of …
Analysis of Repeated Measures - Purdue University
www.stat.purdue.eduRepeated Measures, STAT 514 1 Analysis of Repeated Measures Hao Zhang 1 Introduction In many applications, multiple measurements are made on the same experimental units over a period
Introduction to Genetic Association Studies
www.stat.purdue.eduTopic Introduction Introduction to Genetic Association Studies Cathryn M. Lewis and Jo Knight Genetic association studies are used to find candidate genes or genome regions that contribute to a
Chapter 6: Confidence Intervals and Hypothesis Testing
www.stat.purdue.eduState your conclusion about the data in a sentence, using the P‐value and/or comparing the P ‐value to a significance level for your evidence. STEP 1: State the null hypothesis H …
Description of controlled spike-in experiment
www.stat.purdue.eduDescription of controlled spike-in experiment September 19, 2011 1 Experimental design The experiment aimed at evaluating the ability of signi cance analysis to detect known fold changes, as well
CV with Publications
www.stat.purdue.eduCurriculum Vitae S.V.N. Vishwanathan Teaching Selected Graduate Courses 2015 Advanced Machine Learning 2014 { 2015 Analysis of Algorithms 2011 { 2014 Introduction to Computing for Statisticians

6 Finite Sample Theory of Order Statistics and Extremes
www.stat.purdue.edu6 Finite Sample Theory of Order Statistics and Extremes The ordered values of a sample of observations are called the order statistics of the sample, and the
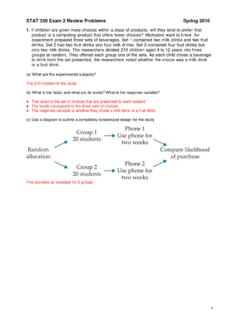
STAT 350 Exam 2 Review Problems Spring 2016
www.stat.purdue.eduSTAT 350 Exam 2 Review Problems Spring 2016 3 2. A random sample of 26 offshore oil workers took part in a simulated escape exercise, and their times (sec) to complete the escape are recorded. The sample mean is 370.69 sec and the sample standard deviation is 24.36 sec. Construct a 95% lower confidence bound on the true average escape time.

Mixed Models - Purdue University
www.stat.purdue.edu1 Introduction In many experimental design situations, one or more of the factors in the study may be random factors. That is, the levels of those factors are actually a sample from a larger population of levels and inferences are desired
18 The Exponential Family and Statistical Applications
www.stat.purdue.eduof the general Exponential family is provided in this chapter. Classic expositions are available in Barndorfi-Nielsen (1978), Brown (1986), and Lehmann and Casella (1998). An excellent recent treatment is available in Bickel and Doksum (2006). 18.1 One Parameter Exponential Family Exponential families can have any flnite number of parameters.
Related documents

The Randomized Complete Block Design (RCBD) - …
pbgworks.orgThe Randomized Complete Block Design (RCBD) Trudi Grant Department of Horticulture and Crop Science OARDC, The Ohio State University 2010

TRIMESTER WISE DISTRIBUTION OF COURSES I …
pgs.iasri.res.in260 6 agricultural statistics trimester wise distribution of courses i trimester lp pgs 504basic statistical methods in agriculture 2 1 as 501 basic statistical methods 2 1 as 550 mathematical methods 4 0 as 560 probability theory 2 0 as 561 statistical methods 2 1 as 567 applied multivariate analysis 2 1 as 568 econometrics 2 1 as 569 planning of …

A First Course in Design and Analysis of Experiments
users.stat.umn.eduA First Course in Design and Analysis of Experiments Gary W. Oehlert University of Minnesota

research methods & reporting - CONSORT Statement
www.consort-statement.org700 BMJ | 27 March 2010 | VoluMe 340 research methods & reporting Box 1 | Noteworthy general changes in CONSORT 2010 Statement • We simplified and clarified the wording, such as in items 1, 8, 10, 13, 15, 16, 18, 19, and 21 • We improved consistency of style across the items by removing the imperative verbs that
Effects of Chicken Manure on Growth, Yield and …
www.idosi.orgAm-Euras. J. Agric. & Environ. Sci., 12 (3): 399-406, 2012 401 Table 1: Physical and chemical characteristics of the medium (sand) and chicken manure used in …

EXPERIMENTAL DESIGNS Why Use Experimental …
www2.hawaii.edu3.1 EXPERIMENTAL DESIGNS Why Use Experimental Designs? Experimental designs are used so that the treatments may be assigned in an organized manner to allow valid statistical analysis to be carried out on the resulting data.

Salt Tolerance of Germinating Alfalfa Seeds - NAAIC
naaic.orgStandard Tests to Characterize Alfalfa Cultivars Salt Tolerance of Germinating Alfalfa Seeds A-3 March 1991