Transcription of Analysis of Repeated Measures - Purdue University
1 Repeated Measures , STAT 5141 Analysis of Repeated MeasuresHao Zhang1 IntroductionIn many applications, multiple measurements are made on the same experimental units over a periodof time. Such data are called Repeated Measures . An example is growth curve data such as dailyweights of chicks on different diets. The design for Repeated Measures could be one of the standarddesign, , a completely randomized design or a randomized complete block design. For example,three diet treatments are randomly assigned to the chicks according to a completely randomizeddesign. The experiment units are the chicks and each chick is observed weekly for some treatment factor is diet and is often referred to as the between-subjects factor. Time is alsoregarded as a factor and referred to as within-subject factor.
2 The experimental units are often Repeated Measures experiments, interest centers treatment means change over time; treatment differences change over time, , is there a treatment by time interaction?These questions arise in any factorial experiment and there is nothing peculiar about the ob-jectives of a Repeated Measures experiment. What makes the Repeated Measures data analysisdistinctive is the covariance structure of the observed data those data from the same subject maybe correlated and the correlation should be modeled if it Statistical Modelling and AnalysisThe modelling and Analysis of Repeated Measures are a complex topic. In this section, we onlyhighlight some models and analyses by looking at some real data The Univariate Analysis of Variance ApproachExample 1.
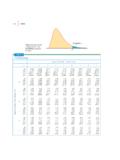
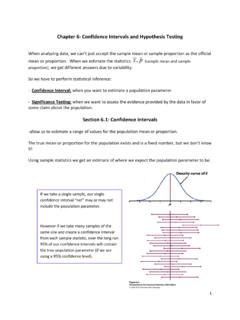
3 (Alzheimer s Data, Hand and Taylor,1987, Table ) Two groups of patients withalzheimer s disease were compared, one of which had 26 patients and received placebo, and the otherhad 22 and was treated with lecithin. The response variable is the number of words that a patientcan recall from lists of words. The response variable was measured at time units 0, 1, 2, 4, and of the data are given in Figure the graph, we can see differences between subjects within each group as well as differencesbetween the two groups. In general, we will regard subject effects as random effects. In someanalyses, the Repeated Measures from the same subject are assumed to be independent. If we takethis position, we will have theunivariate Analysis of variance approach. The correspondingstatistical model for this experiment isyijk= + i+dj(i)+ k+ ( )ik+ ijk,(1)where i, kand ( )ikare fixed effects of treatmenti, timek, and their interaction, respectively,dj(i)is the random effect associated with thejthsubject in groupi, ijkis random error associatedRepeated Measures , STAT 5142timeTest score012345605101520timeTest score012345605101520 Figure 1: Alzheimer study response profiles: Placebo group on right, lecithin group on thejthsubject in groupiat timek,dj(i)are (0, 2s) and ijkare (0, 2).
4 NotethatE(yijk) = + i+ k+ ( )ik, V ar(yijk) = 2s+ 2,and the covariance between any two different observations on the same subject isCov(yijk, yijk ) =V ar(dj(i)) = 2s, j6=j . Such a covariance structure is called compound symmetric. Note alsocompound symmetry implies that var(yij yij ) is a constant for anyj6=j . Such a condition iscalledsphericity. Many computer programs report the results of the Mauchly test of sphericitythough it seems this test is not powerful for detecting small departures from sphericity. Someadjusted F-tests for non-sphericity exist. Model (1) is similar to the model we used for split-plotdesigns since subjects are nested within the treatment can use a very flexible SAS procedureproc mixedfor model (1).proc mixed;class group subj time;model response=group time group*time;random subj(group);run;Themodelstatement specifies three fixed effects in the model and therandomstatement specifiesthe random effect(s).
5 We see this model is similar the the model for a split-plot Modelling Covariance StructureAs we said before, Repeated Measures from the same subject are usually dependent. Consider thealzheimer experiment again. The measurements from the same subject on 5 occasions might becorrelated. In this scenario, the model will be essentially the same but the error terms ijkforthe same subject are correlated. We should model this correlation structure. There are threecommonly used covariance structures: compound symmetric, autoregression of order one (AR(1))and SymmetryV ar( ijk) = 2, Cov( ijk, ijk ) = 2, k6=k (1). ijk, k= 1,2, is assumed to be an AR(1) process. Therefore,Cov( ijk, ijk ) = 2 |k k |. Repeated Measures , STAT CovarianceNo mathematical pattern is imposed on the covariance matrixand the covariance structure of the Repeated Measures is estimated using the facts that this co-variance structure remains the same for every subjects, and measurements taken from differentsubjects are ProgramWe use therepeatedstatement inproc mixedwith optionstypeto specify one of the three co-variance structures.
6 For example, if we use the compound symmetric covariance structure for thealzheimer experiment, the SAS program isproc mixed;class group subj time;model response=group time group*time; Repeated /type=cs sub=subj(group) r rcorr;In therepeatedstatement,type=csspecifies the covariance structure type to be compound sym-metric,subspecifies that the compound symmetric structure pertains to submatrics correspondingto each subjects in each group. The optionsrandrcorrrequest printing of covariance matrix andcorrelation we were to use AR(1), we would change therepeatedstatement torepeated/type=ar(1) sub=subj(group) r rcorr;Note, this program is not appropriate for the experiment since the Repeated Measures were taken atunequally spaced time intervals. Usetype=sp(pow)for unequally spaced we use unstructured covariance, we change therepeatedstatement torepeated/type=un sub=subj(group) r rcorr;Some criteria exist for choosing the covariance structure, among which are Akaike s InformationCriterion (AIC) and Schwarz s Bayesian Criterion (SBC).
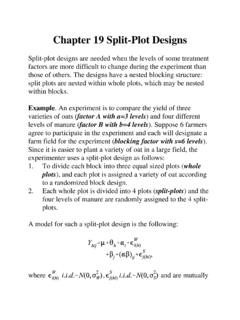
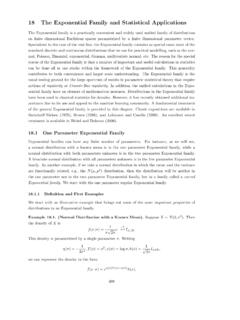
7 Both penalize the log likelihood functionby addition a penalty term which increases with the number of parameters. We then choose thestructure that maximizes a penalized log Modeling Time As a Regression VariableConsider the study on body weights of chicks on different diets. There are four groups, each ondifferent protein diet. Body weights are measured on alternate days. The body weights for the fourgroups are plotted in Figure the plots, we can see the differences between the groups. In addition, there are between-chicks differences within each group. For each chick, the growth curve can be reasonably modeledas a quadratic function of time. A reasonable model would beyijt= + i+t i+t2 i+tbj(i)+t2cj(i)+ ijt,(2)where , i, iand iare fixed parameters, which explain for between-group differences,bj(i)andcj(i)are random coefficients, andbj(i)are (0, 2i,b),cj(i)are (0, 2i,c).
8 The two randomcoefficients explain the between-subject differences within a (i)andcj(i)can be Measures , STAT 5144timeWeight05101520100200300timeWeigh t05101520100200300timeWeight051015201002 00300timeWeight05101520100200300 Figure 2: Growth curves of chicks on four different protein diets.