Example: bankruptcy
Mixed Models - Purdue University
1 Introduction In many experimental design situations, one or more of the factors in the study may be random factors. That is, the levels of those factors are actually a sample from a larger population of levels and inferences are desired
Tags:
Information
Domain:
Source:
Link to this page:
Documents from same domain
CV with Publications
www.stat.purdue.eduCurriculum Vitae S.V.N. Vishwanathan Teaching Selected Graduate Courses 2015 Advanced Machine Learning 2014 { 2015 Analysis of Algorithms 2011 { 2014 Introduction to Computing for Statisticians
Analysis of Repeated Measures - Purdue University
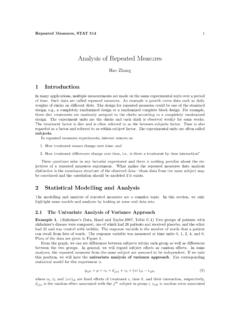
www.stat.purdue.eduRepeated Measures, STAT 514 1 Analysis of Repeated Measures Hao Zhang 1 Introduction In many applications, multiple measurements are made on the same experimental units over a period

Introduction to Genetic Association Studies
www.stat.purdue.eduTopic Introduction Introduction to Genetic Association Studies Cathryn M. Lewis and Jo Knight Genetic association studies are used to find candidate genes or genome regions that contribute to a
Integre Technical Publishing Co., Inc. …
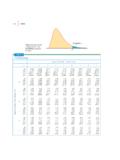
www.stat.purdue.eduTables • T-13 Table entry for p is the critical value F∗ with probability p lying to its right. F* Probability p TABLE E F critical values (continued) Degrees of …
Chapter 19 Split-Plot Designs - Department of …
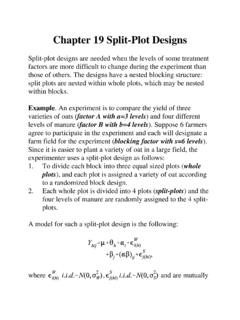
www.stat.purdue.eduChapter 19 Split-Plot Designs Split-plot designs are needed when the levels of some treatment factors are more difficult to change during the experiment than
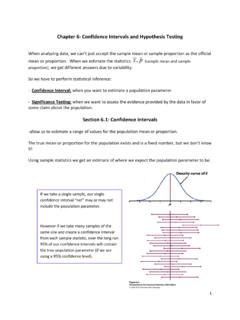
Chapter 6: Confidence Intervals and Hypothesis Testing
www.stat.purdue.eduState your conclusion about the data in a sentence, using the P‐value and/or comparing the P ‐value to a significance level for your evidence. STEP 1: State the null hypothesis H …
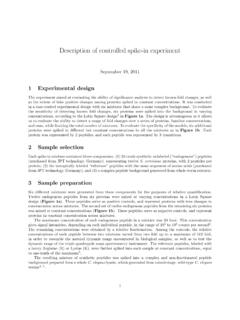
Description of controlled spike-in experiment
www.stat.purdue.eduDescription of controlled spike-in experiment September 19, 2011 1 Experimental design The experiment aimed at evaluating the ability of signi cance analysis to detect known fold changes, as well

6 Finite Sample Theory of Order Statistics and Extremes
www.stat.purdue.edu6 Finite Sample Theory of Order Statistics and Extremes The ordered values of a sample of observations are called the order statistics of the sample, and the
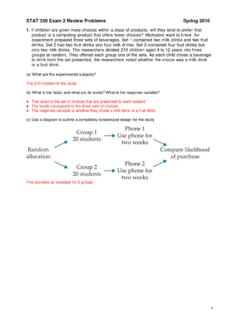
STAT 350 Exam 2 Review Problems Spring 2016
www.stat.purdue.eduSTAT 350 Exam 2 Review Problems Spring 2016 3 2. A random sample of 26 offshore oil workers took part in a simulated escape exercise, and their times (sec) to complete the escape are recorded. The sample mean is 370.69 sec and the sample standard deviation is 24.36 sec. Construct a 95% lower confidence bound on the true average escape time.
18 The Exponential Family and Statistical Applications
www.stat.purdue.eduof the general Exponential family is provided in this chapter. Classic expositions are available in Barndorfi-Nielsen (1978), Brown (1986), and Lehmann and Casella (1998). An excellent recent treatment is available in Bickel and Doksum (2006). 18.1 One Parameter Exponential Family Exponential families can have any flnite number of parameters.
Related documents
Getting Started in Logit and Ordered Logit Regression
www.princeton.eduThe procedure using prvalue in the following pages does not work with Stata 13. PU/DSS/OTR . ... Introduction to Stata ... Statistical Analysis: an interdisciplinary introduction to univariate & multivariate methods / Sam Kachigan, New York : Radius Press, c1986 ...

263-30: PROC FREQ and PROC MEANS: To Stat or Not to Stat
support.sas.comIntroduction Proc FREQ and Proc MEANS are found in the Base SAS product. They have many uses, both statistical and descriptive. To start, it would be useful to review the descriptions of these procedures found in the SAS Procedures Guide: The frequency (FREQ) procedure produces one-way to n-way frequency and cross-tabulation tables. For

Hogg Craig Introduction to Mathematical Statistics
www.ru.ac.bditinthedocumentMathematical Primer for Introduction toMathematical Statistics. It is freely available for students to download at the listed url. Besides sequences, this supplement reviews the topics of infinite series, differentiation, and integra-tion (univariate and bivariate). We have also expanded the discussion of iterated integrals in ...

Analysis of Cell Cycle by Flow Cytometry
www.tcd.ieIntroduction A variety of flow or cytometric methods to analyze the cell cycle progres-sion have been developed over the past three decades. These methods can be grouped into three categories: 1. In the first are the methods that rely on a single time point (“snapshot”) cell measurement. This analysis may be either univariate, generally ...

A Simple Explanation of Partial Least Squares
users.cecs.anu.edu.au1 Introduction Partial Least Squares (PLS) is a widely used technique in chemometrics, especially in the case where the number of independent variables is signi cantly larger than the number of data points. There are many articles on PLS [HTF01, GK86] but the mathematical details of PLS do not always come out clearly in these treatments.
Cross-Sectional Study Design and Data Analysis
yes-competition.orgPROCEDURE: Teachers should ask the students to read Sections I–V at home, and then in class the teacher should review the major concepts contained therein. The teacher should cover Section VI during the class period, using the worked example as a guide as needed. The groups should then assemble and begin to work together in class on the group ...

Equal or Value Weighting? Implications for Asset-Pricing Tests
risk.edhec.edu1. Introduction On the one hand, the value-weighted “market“ portfolio has played a central role in asset pricing, for instance in the Capital Asset Pricing Model of Sharpe (1964), On the other hand, the use of equal-weighted mean returns is ubiquitous in empirical finance. 1 Does the choice between equal-

Multicollinearity: What Is It, Why Should We Care, and How ...
support.sas.comINTRODUCTION . Multicollinearity is often described as the statistical phenomenon wherein there exists a perfect or exact relationship between predictor variables. From a conventional standpoint, this occurs in regression when several predictors are highly correlated. Another way to think of collinearity is “co-dependence” of variables.
INTRODUCTION MACHINE LEARNING - Stanford University
ai.stanford.edu1.1. INTRODUCTION 3 Human designers often produce machines that do not work as well as desired in the environments in which they are used. In fact, certain char-acteristics of the working environment might not be completely known at design time. Machine learning methods can be used for on-the-job improvement of existing machine designs.
INTRODUCTION MACHINE LEARNING
ai.stanford.edu1.1. INTRODUCTION 3 Human designers often produce machines that do not work as well as desired in the environments in which they are used. In fact, certain char-acteristics of the working environment might not be completely known at design time. Machine learning methods can be used for on-the-job improvement of existing machine designs.
Related search queries
PROCEDURE, INTRODUCTION, Univariate, PROC FREQ, Proc, Introduction Proc FREQ, Analysis of Cell Cycle by Flow Cytometry, Partial Least Squares, Introduction Partial Least Squares, Cross-Sectional Study Design and Data Analysis, Value-weighted, Weighted, Multicollinearity, INTRODUCTION MACHINE LEARNING, Machine learning