
Chapter 2: Simple Linear Regression
1 The model The simple linear regression model for nobser- vations can be written as yi= β 0 +β 1xi+ei, i= 1,2,··· ,n. (1) The designation simple indicates that there is only one predictor variable x, and linear means that the model is linear in β 0 and β 1.The intercept β 0 and the slope β 1 are unknown constants, and
Download Chapter 2: Simple Linear Regression

Information
Domain:
Source:
Link to this page:
Documents from same domain
Integre Technical Publishing Co., Inc. …
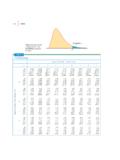
www.stat.purdue.eduTables • T-13 Table entry for p is the critical value F∗ with probability p lying to its right. F* Probability p TABLE E F critical values (continued) Degrees of …
Analysis of Repeated Measures - Purdue University
www.stat.purdue.eduRepeated Measures, STAT 514 1 Analysis of Repeated Measures Hao Zhang 1 Introduction In many applications, multiple measurements are made on the same experimental units over a period
Chapter 19 Split-Plot Designs - Department of …
www.stat.purdue.eduChapter 19 Split-Plot Designs Split-plot designs are needed when the levels of some treatment factors are more difficult to change during the experiment than

Introduction to Genetic Association Studies
www.stat.purdue.eduTopic Introduction Introduction to Genetic Association Studies Cathryn M. Lewis and Jo Knight Genetic association studies are used to find candidate genes or genome regions that contribute to a
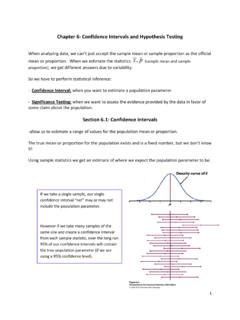
Chapter 6: Confidence Intervals and Hypothesis Testing
www.stat.purdue.eduState your conclusion about the data in a sentence, using the P‐value and/or comparing the P ‐value to a significance level for your evidence. STEP 1: State the null hypothesis H …
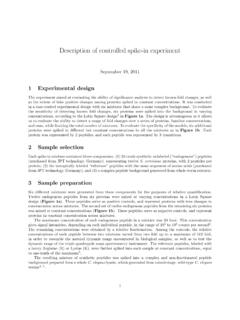
Description of controlled spike-in experiment
www.stat.purdue.eduDescription of controlled spike-in experiment September 19, 2011 1 Experimental design The experiment aimed at evaluating the ability of signi cance analysis to detect known fold changes, as well

CV with Publications
www.stat.purdue.eduCurriculum Vitae S.V.N. Vishwanathan Teaching Selected Graduate Courses 2015 Advanced Machine Learning 2014 { 2015 Analysis of Algorithms 2011 { 2014 Introduction to Computing for Statisticians

6 Finite Sample Theory of Order Statistics and Extremes
www.stat.purdue.edu6 Finite Sample Theory of Order Statistics and Extremes The ordered values of a sample of observations are called the order statistics of the sample, and the
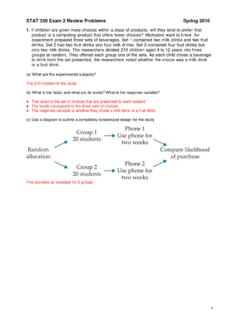
STAT 350 Exam 2 Review Problems Spring 2016
www.stat.purdue.eduSTAT 350 Exam 2 Review Problems Spring 2016 3 2. A random sample of 26 offshore oil workers took part in a simulated escape exercise, and their times (sec) to complete the escape are recorded. The sample mean is 370.69 sec and the sample standard deviation is 24.36 sec. Construct a 95% lower confidence bound on the true average escape time.

Mixed Models - Purdue University
www.stat.purdue.edu1 Introduction In many experimental design situations, one or more of the factors in the study may be random factors. That is, the levels of those factors are actually a sample from a larger population of levels and inferences are desired
Related documents

1. Linear Probability Model vs. Logit (or Probit)
are.berkeley.eduLinear Probability Model Logit (probit looks similar) This is the main feature of a logit/probit that distinguishes it from the LPM – predicted probability of =1 is never below 0 or above 1, and the shape is always like the one on the right rather than a straight line.
The Comprehensive R Archive Network
cran.r-project.orgWe would like to show you a description here but the site won’t allow us.

The Levenberg-Marquardt algorithm for nonlinear least ...
people.duke.eduting a parameterized mathematical model to a set of data points by minimizing an objective expressed as the sum of the squares of the errors between the model function and a set of data points. If a model is linear in its parameters, the least squares ob-jective is quadratic in the parameters. This objective may be minimized with respect

Linear Forced Through Zero
www.azdhs.govLinear Forced Through Zero It is often tempting to exclude the intercept, a, from the model because a zero stimulus on the -xaxis should lead to a zero response on the -yaxis. However, the correct procedure is to fit the full model and test for the significance of the intercept term
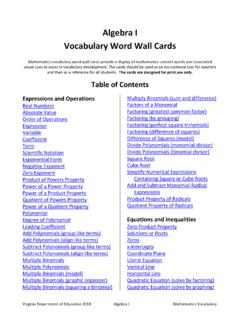
Algebra I Vocabulary Word Wall Cards
www.doe.virginia.govLinear Equation (point-slope form) Equivalent Forms of a Linear Equation Slope Slope Formula Slopes of Lines Perpendicular Lines Parallel Lines Mathematical Notation System of Linear Equations (graphing) System of Linear Equations (substitution) System of Linear Equations (elimination) System of Linear Equations (number of solutions)
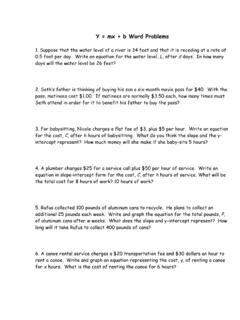
Linear Equation Word Problems - San Juan Unified School ...
www.sanjuan.edulinear depreciation (loss of value) of $200 per year. Let y be the declared value of the computer after x years. What is the slope of the line that models this depreciation? Find the y-intercept of the line. Write a linear equation in slope-intercept form to model the value of the computer over time. Find the vale of the computer after 4.5 ...
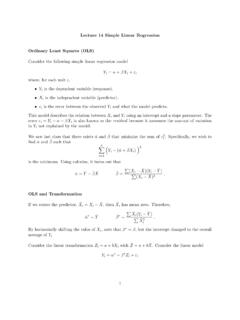
Lecture 14 Simple Linear Regression Ordinary Least Squares ...
www2.stat.duke.edub into the linear model. Y i = + X i + "i Y i = + Z i a b + "i Y i = a b + b Z i + "i Y i = + Z i + "i Properties of OLS Given the estimates ^ and ^, we can de ne (1) the estimated predicted value Y^ i and (2) the estimated residual ^" i. Y^ i = ^ + X^ i "^ i = Y i Y^ i = Y i ^ X^ i The least squared estimates have the following properties. 1 ...