
Chapter 2: Simple Linear Regression
2 Ordinary Least Square Estimation The method of least squares is to estimate β 0 and β 1 so that the sum of the squares of the differ- ence between the observations yiand the straight line is a minimum, i.e., minimize S(β 0,β 1) = Xn i=1 (yi−β 0 −β 1xi) 2.
Download Chapter 2: Simple Linear Regression

Information
Domain:
Source:
Link to this page:
Documents from same domain
Integre Technical Publishing Co., Inc. …
www.stat.purdue.eduTables • T-13 Table entry for p is the critical value F∗ with probability p lying to its right. F* Probability p TABLE E F critical values (continued) Degrees of …
Analysis of Repeated Measures - Purdue University
www.stat.purdue.eduRepeated Measures, STAT 514 1 Analysis of Repeated Measures Hao Zhang 1 Introduction In many applications, multiple measurements are made on the same experimental units over a period
Chapter 19 Split-Plot Designs - Department of …
www.stat.purdue.eduChapter 19 Split-Plot Designs Split-plot designs are needed when the levels of some treatment factors are more difficult to change during the experiment than
Introduction to Genetic Association Studies
www.stat.purdue.eduTopic Introduction Introduction to Genetic Association Studies Cathryn M. Lewis and Jo Knight Genetic association studies are used to find candidate genes or genome regions that contribute to a
Chapter 6: Confidence Intervals and Hypothesis Testing
www.stat.purdue.eduState your conclusion about the data in a sentence, using the P‐value and/or comparing the P ‐value to a significance level for your evidence. STEP 1: State the null hypothesis H …
Description of controlled spike-in experiment
www.stat.purdue.eduDescription of controlled spike-in experiment September 19, 2011 1 Experimental design The experiment aimed at evaluating the ability of signi cance analysis to detect known fold changes, as well
CV with Publications
www.stat.purdue.eduCurriculum Vitae S.V.N. Vishwanathan Teaching Selected Graduate Courses 2015 Advanced Machine Learning 2014 { 2015 Analysis of Algorithms 2011 { 2014 Introduction to Computing for Statisticians

6 Finite Sample Theory of Order Statistics and Extremes
www.stat.purdue.edu6 Finite Sample Theory of Order Statistics and Extremes The ordered values of a sample of observations are called the order statistics of the sample, and the
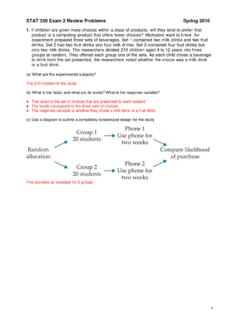
STAT 350 Exam 2 Review Problems Spring 2016
www.stat.purdue.eduSTAT 350 Exam 2 Review Problems Spring 2016 3 2. A random sample of 26 offshore oil workers took part in a simulated escape exercise, and their times (sec) to complete the escape are recorded. The sample mean is 370.69 sec and the sample standard deviation is 24.36 sec. Construct a 95% lower confidence bound on the true average escape time.

Mixed Models - Purdue University
www.stat.purdue.edu1 Introduction In many experimental design situations, one or more of the factors in the study may be random factors. That is, the levels of those factors are actually a sample from a larger population of levels and inferences are desired
Related documents

The Rational Method - David B. Thompson
drdbthompson.netThe Rational Method∗ David B. Thompson Civil Engineering Deptartment Texas Tech University Draft: 20 September 2006 1. Introduction For hydraulic designs on very small watersheds, a complete hydrograph of runoff is not
Introduction to EDS analysis - EMC
emc.missouri.eduanalysis method. -ZAF. P/B-ZAF standardless analysis is a ess and self-calibrating spectrum analysis procedure, based on modified ZAF matrix correction formulas. Absolute concentration values are obtained without the use of explicit or implicit standards and without system factor calibration. Using the P/B-ZAF algorithm the characteristic X-ray
Chapter 9 AC Sweep and Signal Analysis - UWECE
class.ece.uw.eduThe AC analysis statement permits sweeping values for: Frequency Element Temperature Model parameter Randomized distribution (Monte Carlo) Optimization and AC design analysis Additionally, as part of the small signal analysis tools, Star-Hspice provides: Noise analysis Distortion analysis Network analysis Sampling noise
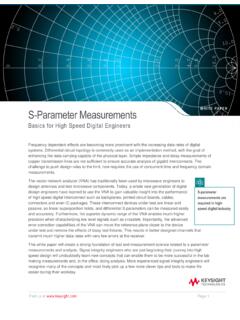
S-Parameter
literature.cdn.keysight.comJun 18, 2019 · S-Parameter Measurements Basics for High Speed Digital Engineers Frequency dependent effects are becoming more prominent with the increasing data rates of digital systems. Differential circuit topology is commonly-used as an implementation method, with the goal of enhancing the data carrying capable of the physical layer.

Improving the Analysis of 37 Fatty Acid Methyl Esters
www.agilent.com3 Table 2. Agilent J&W CP-Sil 88 for FAME method conditions. Parameter Value GC system Agilent 7890B/FID Column Agilent J&W CP-Sil 88 for FAME, 100 m × 0.25 mm, 0.20 µm (p/n CP7489) Carrier gas Helium, 32 psi, constant pressure mode Inlet Split/splitless, 260 °C, split ratio 50:1 Oven 100 °C (5 minutes), 5
Loop Stability Analysis - University of Delaware
www.eecis.udel.eduThe STB analysis linearizes the circuit about the DC operating point and computes the loop-gain, gain and phase margins (if the sweep variable is frequency), for a feedback loop or a gain device [1]. Refer to the Spectre Simulation Refrence [1] and [2] for details. Uses return ratio analysis method to calculate loop-gain and phase

Asymptotic Analysis and Singular Perturbation Theory
www.math.ucdavis.edusmall parameter here is simply for de niteness; for example, a problem depending on a large parameter !can be rewritten as one depending on a small parameter "= 1=!. The focus of these notes is on perturbation problems involving di erential equa-tions, but perturbation theory and asymptotic analysis apply to a broad class of problems.

Introduction to Interrupted Time Series Analysis
www.sas.comBuilding on Single Series Method • Treatment and control time series are appended • Regression equation is expanded: y = α+ β 1 T+ β 2 X + β 3 XT+ β 4 Z + β 5 ZT + β 6 ZX + β 7 ZXT + ε where Z = treatment or control, ZT= time for treatment and 0 for control, ZX= study phase for treatment and 0 for control, ZXT= time after ...