
Checking normality in Excel
Excel will not perform non-parametric tests even with the data analysis toolpak add in. Both AI-therapy and the ‘Real-Statistics’ add in will though. Using the data analysis toolpak . Although this is a standard Excel add in package, you will need to add it via File > Options > Add-Ins (see ‘Additional toolpaks in Excel’ sheet for details).
Download Checking normality in Excel

Information
Domain:
Source:
Link to this page:
Documents from same domain

Global Opportunities & Exchanges.
www.sheffield.ac.ukGlobal Opportunities & Exchanges. Study Abroad Programme – Frequently Asked Questions . Spend a year studying in Australia, Canada, China, …
CIPD Mentoring Factsheet - University of Sheffield
www.sheffield.ac.ukMentoring Coaching Ongoing relationship that can last for a ... • be clear about what the different types of mentoring and any diagnostic tools/models used

Evaluation of NHS 111 pilot sites Final Report
www.sheffield.ac.ukEvaluation of NHS 111 pilot sites – Final Report Page 3. 7.2 Methods 7.3 Results
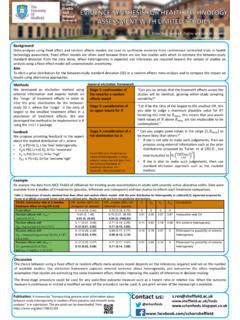
s.ren@sheffield.ac.uk …
www.sheffield.ac.ukShijie Ren, Jeremy E. Oakley and John W. Stevens University of Sheffield s.ren@sheffield.ac.uk www.facebook.com/scharrsheffield School Of Health And

Two-way (between-groups) ANOVA in R
www.sheffield.ac.ukTwo-way ANOVA in R statstutor Community Project © Sofia Maria Karadimitriou and Ellen Marshall www.statstutor.ac.uk University of Sheffield stcp-karadimitriou-ANOVA2

Ethical considerations in research with children …
www.sheffield.ac.ukparticipate in the project. Continuing to negotiate consent with children throughout the project can help overcome this issue and if the researcher feels that the children’s refusal to

Ambulance Response Programme - The University of Sheffield
www.sheffield.ac.ukAmbulance Response Programme Evaluation of Phase 1 and Phase 2 Final Report Janette Turner Richard Jacques Annabel Crum Joanne Coster Tony Stone

PHY331 Magnetism - University of Sheffield
www.sheffield.ac.ukPHY331 Magnetism Lecture 10 . Last week… • We saw that if we assume that the internal magnetic field is proportional to the magnetisation of the paramagnet, we can get a spontaneous magnetization for temperatures less than the Curie Temperature. ... Pauli paramagnetism - the approximate method, at ...
Chapter 7: Research design - The University of Sheffield
www.sheffield.ac.ukChapter 7: Research design As stated in the introduction, the research design adopted in this inquiry was primarily influenced by Guba and Lincoln’s (1985) conception of Naturalistic Inquiry, ... Crotty’s (1998) four research design elements. Decisions that were taken that influenced the research design are woven into the narrative.

autoCAD tutorial 1 - University of Sheffield
www.sheffield.ac.ukUNIVERSITY OF SHEFFIELD; LANDSCAPE DEPARTMENT AUTOCAD 2013/14/15 TUTORIALS - SESSION 1 Page 2 SESSION ONE AutoCAD is installed on all the department’s computers on Floors 10 and 11 so should be available from the start menu once you’ve logged in.
Related documents

Create a Grade Distribution Graph in Excel
cpb-ap-se2.wpmucdn.comdistribution graph in Excel Export gradebook Export your Canvas gradebook as a CSV file. Create grade distribution graph 1. Open the file in Excel. 2. Select the whole spreadsheet. 3. On the Menu Task Bar, select Insert > Recommended PivotTables. 4. Select the table that offers “Final Grades as Row” and “Count of Students” as values.

Word and Excel Practice Exercise
engineering.queensu.cayour graph. 2. Do include axis titles (with units). 3. Eliminate/Reduce horizontal and vertical gridlines when appropriate. Horizontal and vertical gridlines should only be included if they highlight key data points or are critical for making your graph more legible. 4. Avoid using colour where possible. 5.
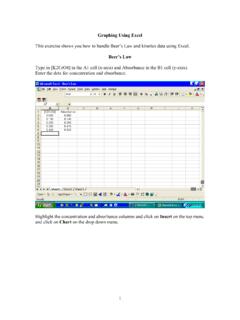
Graphing in Excel - Community College of Rhode Island
www.ccri.eduGraphing Using Excel This exercise shows you how to handle Beer’s Law and kinetics data using Excel. Beer’s Law Type in [K2CrO4] in the A1 cell (x-axis) and Absorbance in the B1 cell (y-axis). Enter the data for concentration and absorbance. Highlight the concentration and absorbance columns and click on Insert on the top menu

TA Excel による実験データのグラフ化 - Osaka U
www.library.osaka-u.ac.jpExcel に様々なグラフの種類があるが実験データの図示には 「散布図」が最もふさわしい。 「折れ線」を選ばないように注意 理由:「折れ線」は横軸が固定されてしまう 図には必ずタイトルをつけること。

How to create graphs with a “best fit line” in Excel
www.utsa.eduHow to create graphs with a “best fit line” in Excel . 2In this manual, we will use two examples: y = x, a linear graph; and y = x, a non-linear graph. The y-values were specifically chosen to be inexact to illustrate what you will see when you analyze data from your labs.

Trendline Analysis in Excel - Laramie, Wyoming
www.uwyo.edu2 n 0 20 40 60 80 100 0 5 10 15 t h t h 1. To utilize the Trendline Analysis tool, an XY Scatter graph must already be present. The graph above was created by selecting the two columns of data, clicking on the Insert tab, then in the Charts group …