Correlation in Random Variables
Correlation Coefficient The covariance can be normalized to produce what is known as the correlation coefficient, ρ. ρ = cov(X,Y) var(X)var(Y) The correlation coefficient is bounded by −1 ≤ ρ ≤ 1. It will have value ρ = 0 when the covariance is zero and value ρ = ±1 when X and Y are perfectly correlated or anti-correlated. Lecture 11 4
Download Correlation in Random Variables

Information
Domain:
Source:
Link to this page:
Documents from same domain
Propagation of Waves - RIT Center for Imaging Science
www.cis.rit.eduPROPAGATION OF WAVES 7.1.2 Cylindrical Waves If a wave is emitted from a line source, the wavefronts are cylindrical. Since the wave expands to Þll a cylinder of radius r0, the wavefront crosses a cylindrical area that grows as Area =2πrh ∝ r.
Lecture 3: Basic Morphological Image Processing
www.cis.rit.eduSep 13, 2005 · Morphological processing is described almost entirely as operations on sets. In this discussion, a set is a collection of pixels in the context of an image. Our sets will be collections of points on an image grid G of size N × M pixels. DIP Lecture 3 1. Pixel Location
Chapter 6 Maxwell’s Equations for Electromagnetic Waves
www.cis.rit.eduChapter 6 Maxwell’s Equations for Electromagnetic Waves 6.1 Vector Operations Any physical or mathematical quantity whose amplitude may be decomposed into “directional” components often is represented conveniently as a vector. In this dis-cussion, vectors are denoted by bold-faced underscored lower-case letters, e.g., x.The

Poisson and Normal Distributions
www.cis.rit.eduPoisson Distribution • The Poisson∗ distribution can be derived as a limiting form of the binomial distribution in which n is increased without limit as the product λ =np is kept constant. • This corresponds to conducting a very large number of Bernoulli trials with the probability p of success on any one trial being very small. • The Poisson distribution can also be derived …
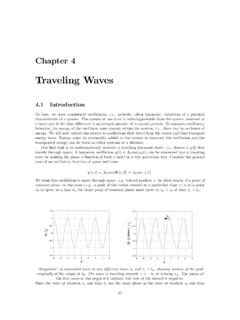
Traveling Waves - Chester F. Carlson Center for Imaging ...
www.cis.rit.edu32 CHAPTER 4. TRAVELING WAVES amplitudes over a discrete set of frequencies: y[z,t]= X∞ n=1 y n X∞ n=1 Ancos[knz−ωnt+φ], where An,kn,andωnare the amplitude, angular spatial frequency, and angular spatial frequency of the nthwave.Therefore, we can define the phase velocity of the nthwave as: (vφ)n ωn kn Now suppose that a particular anharmonic oscillation is …

Lecture 2: Geometric Image Transformations
www.cis.rit.eduSep 08, 2005 · Rochester Institute of Technology rhody@cis.rit.edu September 8, 2005 Abstract Geometric transformations are widely used for image registration and the removal of geometric distortion. Common applications include construction of mosaics, geographical mapping, stereo and video. DIP Lecture 2
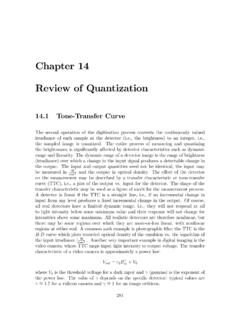
Chapter 14 Review of Quantization - Chester F. Carlson ...
www.cis.rit.eduhold circuits. The simplest quantizer converts an analog input voltage to a 1-bit digital output and can be constructed from an ideal di fferential amplifier, where the output voltage Voutis proportional to the difference of two voltages Vinand Vref: Vout= α(Vin−Vref) Vref is a reference voltage provided by a known source. If αis large ...

Binary Images - Chester F. Carlson Center for Imaging Science
www.cis.rit.eduIndexed color images store a fixed number of colors limited by the bit-depth: 3 bits/pixel : 8 colors 4 bits/pixel : 16 colors 5 bits/pixel:64 colors 8 bits/pixel : 256 colors. File Size Calculation 100 pixels 100 pixels Bit depth = 8 bits per pixel (256 gray levels)
Functions of Random Variables - College of Science | RIT
www.cis.rit.eduSuppose that a random variable U can take on any one of L ran-dom values, say u1,u2,...uL. Imagine that we make n indepen-dent observations of U and that the value uk is observed nk times, k =1,2,...,L.Of course, n1 +n2 +···+nL = n. The emperical average can be computed by u = 1 n L k=1 nkuk = L k=1 nk n uk The concept of statistical ...
Related documents
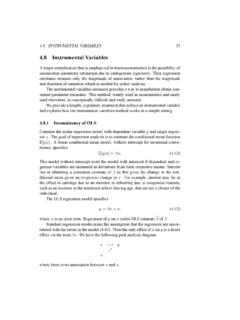
4.8 Instrumental Variables
cameron.econ.ucdavis.eduWhat are the consequences of this correlation between x and u? Now higher levels of x have two effects on y. From (4.43) there is both a direct effect via x and an indirect effect via u effecting x which in turn effects y. The goal of regression is to estimate only the rst effect, yielding an estimate of . The OLS

Covariance, Regression, and Correlation
nitro.biosci.arizona.eduCOVARIANCE, REGRESSION, AND CORRELATION 39 REGRESSION Depending on the causal connections between two variables, xand y, their true relationship may be linear or nonlinear. However, regardless of the true pattern of association, a linear model can always serve as a first approximation. In this case, the analysis is particularly simple, y= fi ...

A Simple Explanation of Partial Least Squares
users.cecs.anu.edu.auFact 12. One way to compute the principal components of a matrix X is to perform singular value decomposition, which gives X = UP T; where U is an n nmatrix made up of the eigenvectors of XXT, P is an m mmatrix made up of the eigenvectors of XTX (i.e., the principal components), and is an n mdiagonal matrix made up of the square roots of the non-zero eigenvalues of both XTX and XXT.
Correlation and Regression
educ.jmu.edu1 Correlation and Regression Basic terms and concepts 1. A scatter plot is a graphical representation of the relation between two or more variables. In the scatter plot of two variables x and y, each point on the plot is an x-y pair. 2. We use regression and correlation to describe the variation in one or more variables. A. The variation is the sum

Linear Mixed-Effects Regression - Statistics
users.stat.umn.eduNesting typically introduces correlation into data at level-1 Students are level-1 and schools are level-2 Dependence/correlation between students from same school We need to account for this dependence when we model the data. Nathaniel E. Helwig (U of Minnesota) Linear Mixed-Effects Regression Updated 04-Jan-2017 : Slide 8
Lecture 8a: Spurious Regression
www.fsb.miamioh.eduThe traditional statistical theory holds when we run regression using (weakly or covariance) stationary variables. For example, when we regress one stationary series onto another stationary series, the coefficient will be close to zero and insignificant if the two series are independent.
Multivariate Regression (Chapter 10)
math.unm.eduMultivariate regression As in the univariate, multiple regression case, you can whether subsets of the x variables have coe cients of 0. In this case, there is a matrix in the null hypothesis, H 0: B d = 0. The E and H matrices are given by E = Y0Y Bb0X0Y H = bB0X0Y Bb0 rX 0 rY And the test statistics are given as before.
Canonical Correlation a Tutorial
www.cs.cmu.eduIn this case, the relation between SNR and correlation is S N = 2 1 2: (17) This relation between correlation and SNR is illustrated in figure 1 (bottom). A Explanations A.1 A note on correlation and covariance matrices In neural network literature, the matrix C xx in equation 3 is often called a corre-lation matrix. This can be a bit ...
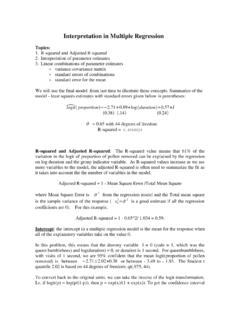
Interpretation in Multiple Regression
www2.stat.duke.eduestimates (recall the correlation is the covariance divided by the product of the standard deviations, so the covariance is the correlation times the product of the standard deviations. Since the standard deviations are unknown, we use the estimated covariance matrix calculated using the standard errors. In the Results options for Regression, check