Describing Relationships between Two Variables
Describing Relationships between Two Variables Up until now, we have dealt, for the most part, with just one variable at a time. This variable, when measured on many different subjects or objects, took the form of a list of numbers. The descriptive techniques we discussed were useful for describing such a list, but more often,
Download Describing Relationships between Two Variables

Information
Domain:
Source:
Link to this page:
Documents from same domain
Midterm Exam 1 Review — Chapters 1, 2, 4 and 5
www.stat.ucla.eduStats 11 (Fall 2004) Lecture Note Instructor: Hongquan Xu Introduction to Statistical Methods for Business and Economics Midterm Exam 1 Review — Chapters 1, 2, 4 …
Estimation of Space–Time Branching Process Models in ...
www.stat.ucla.eduEstimation of Space–Time Branching Process Models in Seismology Using an EM–Type Algorithm Alejandro VEEN and Frederic P. SCHOENBERG Maximum likelihood estimation of branching point process models via numerical optimization procedures can be unstable and computa-tionally intensive. We explore an alternative estimation method based on the ...
Distributions related to the normal distribution - Website
www.stat.ucla.eduDistributions related to the normal distribution Three important distributions: Chi-square (˜2) distribution. tdistribution. Fdistribution. Before we discuss the ˜2;t, and F distributions here are few important things about the gamma distribution.
The Central Limit Theorem - Main Concepts
www.stat.ucla.eduCentral limit theorem - proof For the proof below we will use the following theorem. Theorem: Let X nbe a random variable with moment generating function M Xn (t) and Xbe a random variable with moment generating function M X(t). If lim n!1 M Xn (t) = M X(t) then the distribution function (cdf) of X nconverges to the distribution function of Xas ...

Covariance and correlation - Main Concepts
www.stat.ucla.eduCorrelation: However, the covariance depends on the scale of measurement and so it is not easy to say whether a particular covariance is small or large. The problem is solved by standardize the value of covariance (divide it by ˙ X˙ Y), to get the so called coe cient of correlation ˆ XY. ˆ= cov(X;Y) ˙ X˙ Y; Always, 1 ˆ 1 cov(X;Y) = ˆ ...
Stochastic Difierential Equations
www.stat.ucla.eduthe stochastic calculus. Problem 4 is the Dirichlet problem. Although this is purely deterministic we outline in Chapters VII and VIII how the introduc-tion of an associated Ito difiusion (i.e. solution of a stochastic difierential equation) leads to a simple, intuitive and useful stochastic solution, which is
Normal distribution - University of California, Los Angeles
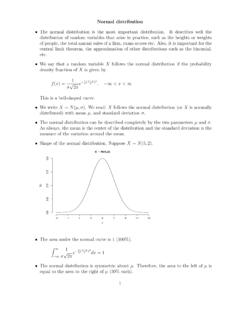
www.stat.ucla.eduWe say that a random variable X follows the normal distribution if the probability density function of Xis given by f(x) = 1 ˙ p 2ˇ e 1 2 (x ˙)2; 1 <x<1 This is a bell-shaped curve. We write X˘N( ;˙). We read: Xfollows the normal distribution (or Xis normally distributed) with mean , and standard deviation ˙.
Bootstrap Hypothesis Test - University of California, Los ...
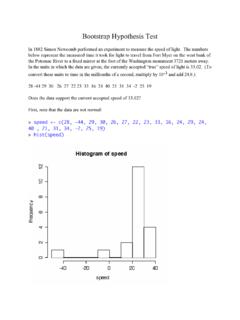
www.stat.ucla.eduWhat if we used the t-test? Since the data now look normal, there’s no reason not to. > t.test(betterspeed,alternative="two.sided",mu=33.02) One Sample t-test data: betterspeed t = -4.6078, df = 17, p-value = 0.0002508 alternative hypothesis: true mean is not equal to 33.02 95 percent confidence interval: 23.83863 29.60582 sample estimates ...
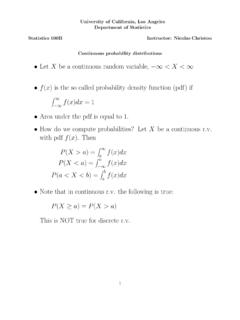
Z f x dx = 1 be a continuous r.v. f x
www.stat.ucla.eduSuppose Xfollows the exponential distribution with = 1. If Y = p X nd the pdf of Y. Example 2 Let X ˘N(0;1). If Y = eX nd the pdf of Y. Note: Y it is said to have a log-normal distribution. Example 3 Let Xbe a continuous random variable with pdf f(x) = 2(1 x);0 x 1. If Y = 2X 1 nd the pdf of Y. Example 4 Let Xbe a continuous random variable ...
Related documents
A Comparison of Two Theories of Learning -- Behaviorism ...
www.g-casa.comThe two theories of learning discussed are Behaviorism and Constructivism. Skinner and ... other white furry objects such as a Santa mask and Watson's white hair (Watson & Rayner, 1920). Although most psychologists have agreed that psychology is the study of human

SALESFORCE CERTIFIED PLATFORM APP BUILDER
developer.salesforce.comDescribe the capabilities of and use cases for external objects. SECURITY Describe the features and capabilities available to restrict and extend object, record, and field access. Given a set of business requirements, determine the appropriate sharing solution.

POV INSPECTION CHECKLIST At least a two week period …
api.army.milAt least a two week period should be allowed to ensure timely repairs. ITEM WHAT TO CHECK LOOK FOR KNOWN DEFICIENCIES CHECK OFF TIRES Condition NOTE: No mixing of radial tires and bias tires. Spare tire Tread depth, wear, weathering, evenly seated, bulges, imbedded objects, cuts, breaks. At least one mm of tread over entire traction surface.

Protocols additional to the Geneva Conventions of 12 ...
www.icrc.orgThe Final Act, to which the two Protocols were annexed, was deposited with the Swiss Federal Council, the depositary of the 1949 Conventions. Protocols I and II came into force on 7 December 1978. This volume also contains the official text of the Protocol additional to the Geneva Conventions of 12 August 1949, and relating to the Adoption of an

The Pigeonhole Principle - Stanford University
web.stanford.eduUsing the Pigeonhole Principle To use the pigeonhole principle: Find the m objects to distribute. Find the n < m buckets into which to distribute them. Conclude by the pigeonhole principle that there must be two objects in some bucket. The details of how to proceeds from there are specific to the particular proof you're doing.

One-to-one
www.math.utah.edutwo points that have the same second coordinate – for example, (2,3) and (4,3). That would mean that f(2) and f(4) both equal 3, and one-to-one functions can’t assign two dierent objects in the domain to the same object of the target. If every horizontal line in R2 intersects the graph of a function at most once, then the function is one-to ...

Definition: A set is a collection of objects. The objects
www.math.wsu.eduDefinition: A set is a collection of objects. The objects belonging to the set are called the elements of the set. Sets are commonly denoted with a capital letter, such as ... following two conditions are met: 1. Every element of A is an element of B ( ⊆ ) and 2. Every element of B is an element of A ( ⊆ ).

Dates and times with lubridate : : CHEAT SHEET
evoldyn.gitlab.ioint_aligns(int1, int2) Do two intervals share a boundary? Also int_overlaps(). int_aligns(i, j) int_diff(times) Make the intervals that occur between the date-times in a vector. v <-c(dt, dt + 100, dt + 1000)); int_diff(v) int_flip(int) Reverse the direction of an interval. Also int_standardize(). int_flip(i) int_length(int) Length in seconds.

Visual Attention and Eye Movements
www.ics.uci.eduThere are two major functions to the eye, fixation and tracking. Fixation is to position the target object into the fovea. This allows our eyes to maximize the focus we can give to the object. Tracking is the ability to fixate on objects even when they are moving. This is important because most real world objects move, and