Transcription of Normal distribution - University of California, Los Angeles
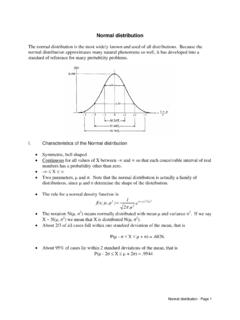
1 Normal distribution The Normal distribution is the most important distribution . It describes well thedistribution of random variables that arise in practice, such as the heights or weightsof people, the total annual sales of a firm, exam scores etc. Also, it is important for thecentral limit theorem, the approximation of other distributions such as the binomial,etc. We say that a random variableXfollows the Normal distribution if the probabilitydensity function ofXis given byf(x) =1 2 e 12(x )2, < x < This is a bell-shaped curve. We writeX N( , ). We read:Xfollows the Normal distribution (orXis normallydistributed) with mean , and standard deviation . The Normal distribution can be described completely by the two parameters and .As always, the mean is the center of the distribution and the standard deviation is themeasure of the variation around the mean.
2 Shape of the Normal distribution . SupposeX N(5,2).xf(x) 3 ~ N(5,2) The area under the Normal curve is 1 (100%). 1 2 e 12(x )2dx= 1 The Normal distribution is symmetric about . Therefore, the area to the left of isequal to the area to the right of (50% each).1 Useful rule (see figure above):The interval 1 covers the middle 68% of the interval 2 covers the middle 95% of the interval 3 covers the middle 100% of the distribution . Because the Normal distribution is symmetric it follows thatP(X > + ) =P(X < ) The Normal distribution is a continuous distribution . Therefore,P(X a) =P(X > a),becauseP(X=a) = How do we compute probabilities? Because the following integral has no closed formsolutionP(X > ) = 1 2 e 12(x )2dx=..the computation of Normal distribution probabilities can be done through the standardnormal distributionZ:Z=X Theorem:LetX N( , ).
3 ThenY= X+ follows also the Normal distribution as follows:Y N( + , )Therefore, using this theorem we find thatZ N(0,1)It is said that the random variableZfollows the standard Normal distribution and wecan find probabilities for theZdistribution from tables (see next pages).2 The standard Normal distribution table:345 Example:Suppose the diameter of a certain car component follows the Normal distribution withX N(10,3). Find the proportion of these components that have diameter largerthan Or, if we randomly select one of these components, find the probabilitythat its diameter will be larger than :P(X > ) =P(X 10> 10) =P(X 103> 103)=P(Z > ) = 1 = read the the table. First we find the value ofz= (firstcolumn and first row of the table - the first row gives the second decimal of the valueofz).
4 Therefore the probability that the diameter is larger than :What isz? The value ofzgives the number of standard deviations the particular valueofXlies above or below the mean . In other words,X= z , and in our examplethe valuex= lies standard deviations away from the mean. Of coursezwillbe negative when the value ofxis below the : Find the proportion of these components with diameter less than :P(X < ) =P(Z < 103) =P(Z < ) = Here, the value ofx= lies standard deviations below the mean .Finding percentiles of the Normal distribution :Find the 25thpercentile (or first quartile) of the distribution ofX. In other words, findcsuch thatP(X c) = :First we find (approximately) the probability from the table and we read thecorresponding value ofz.
5 Here it is equal toz= It is negative because thefirst percentile is below the mean. Therefore,x25= 10 (3) = distribution - example:78 Normal distribution - finding probabilities and percentilesSuppose that the weight of navel oranges is normally distributed with mean = 8ounces, and standard deviation = ounces. We can writeX N(8, ). Answerthe following questions:a. What proportion of oranges weigh more than ounces? (or if you randomly se-lect a navel orange, what is the probability that it weighs more than ounces?).P(X > ) =P(Z > ) =P(Z > ) = 1 = What proportion of oranges weigh less than ounces?P(X < ) =P(Z < ) =P(Z < ) = What proportion of oranges weigh less than 5 ounces?P(X <5) =P(Z <5 ) =P(Z < ) = What proportion of oranges weigh more than ounces?
6 P(X > ) =P(Z > ) =P(Z > ) = 1 = What proportion of oranges weigh between and 7 ounces?P( < X <7) =P( < Z <7 ) =P( < Z < ) = = What proportion of oranges weigh between and 14 ounces?P( < X <14) =P( < Z <14 ) =P( < Z <4) 1 = What proportion of oranges weigh between and ounces?P( < X < ) =P( < Z < ) =P( < Z < ) = = Find the 80thpercentile of the distribution ofX. This question can also be askedas follows: Find the value ofXbelow which you find the lightest 80% of all =x x= Find the 5thpercentile of the distribution =x x= Find the interquartile range of the distribution distribution - ExamplesExample 1 The lengths of the sardines received by a certain cannery is normally distributed with mean inches anda standard deviation inch.
7 What percentage of all these sardines is between and inches long?Example 2A baker knows that the daily demand for apple pies is a random variable which follows the Normal distri-bution with mean pies and standard deviation pies. Find the demand which has probability 5% ofbeing 3 Suppose that the height ofUCLA female students has Normal distribution with mean 62 inches and standarddeviation 8 Find the height below which is the shortest 30% of the female Find the height above which is the tallest 5% of the female 4A firm s marketing manager believes that total sales for next year will follow the Normal distribution , withmean of $ million and a standard deviation of $300, What is the probability that the firm s sales will fall within $150000 of the mean?
8 B. Determine the sales level that has only a 9% chance of being exceeded next 5To avoid accusations of sexism in a college class equally populated by male and female students, the professorflips a fair coin to decide whether to call upon a male or female student to answer a question directed to theclass. The professor will call upon a female student if a tails occurs. Suppose the professor does this 1000times during the What is the probability that he calls upon a female student at least 530 times?b. What is the probability that he calls upon a female student at most 480 times?c. What is the probability that he calls upon a female student exactly 510 times?Example 6 MENSAis an organization whose members possess IQs in the top 2% of the If IQs are normally distributed, with mean 100 and a standard deviation of 16, what is the minimumIQ required for admission toMENSA?
9 B. If three individuals are chosen at random from the general population what is the probability that allthree satisfy the minimum requirement forMENSA?Example 7A manufacturing process produces semiconductor chips with a known failure rate Assume that chipfailures are independent of one another. You will be producing 2000 chips Find the expected number of defective chips Find the standard deviation of the number of defective Find the probability (approximate) that you will produce less than 135 8 Suppose that the height (X) in inches, of a 25-year-old man is a Normal random variable with mean = 70inches. IfP(X >79) = what is the standard deviation of this random Normal variable?EXERCISE 9 Suppose that the weight (X) in pounds, of a 40-year-old man is a Normal random variable with standarddeviation = 20 pounds.
10 If 5% of this population is heavier than 214 pounds what is the mean of thisdistribution?Problem 10 AtHeinzketchup factory the amounts which go into bottles of ketchup are supposed to be normally dis-tributed with mean 36 oz. and standard deviation oz. Once every 30 minutes a bottle is selected fromthe production line, and its contents are noted precisely. If the amount of the bottle goes below oz. orabove oz., then the bottle will be declared out of If the process is in control, meaning = 36 oz. and = oz., find the probability that a bottle willbe declared out of In the situation of (a), find the probability that the number of bottles found out of control in aneight-hour day (16 inspections) will be In the situation of (a), find the probability that the number of bottles found out of control in aneight-hour day (16 inspections)