Transcription of Describing Relationships between Two Variables
1 Describing Relationships between Two VariablesUp until now, we have dealt, for the most part, with just one variable at a time. This variable,when measured on many different subjects or objects, took the form of a list of numbers. Thedescriptive techniques we discussed were useful for Describing such a list, but more often,science and society are interested in the relationship between two or more Variables . To take amundane example, it is nice to know what the "typical" weight is, and what the typical height more interesting is to know the relationship between weight and now, and most of this course, we ll stick to relations between only two Variables . The sortsof questions we ll examine are:1. Does y increase with x? Decrease? Does it depend on what values? For example, it seemsintuitive that weight increases with height (taller people tend to weight more), but forother things, perhaps y goes up and then goes back down Suppose y does increase with x.
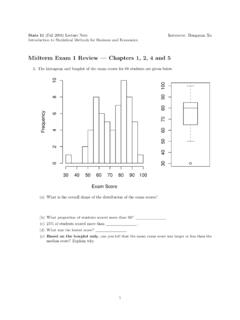
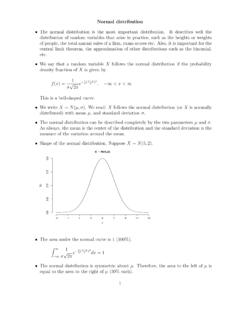
2 How fast? If you are 2 inches taller, how much heavierare you likely to weigh?3. Is the relationship strong? Can you make reliable predictions? That is, if you tell me yourheight, can I predict your weight?To parallel our discussion with just one variable, we ll discussI. Graphical SummariesII. Numerical SummariesGraphical SummaryThe foremost technique is to use scatterplots. Scatterplots plot points (x,y). They give us asummary of what the relationship looks like. Here are the things to look for:1. Is the relationship positive (x goes up and y goes up, x goes down and y goes down),negative (x goes up, y goes down), or is there no relationship? (Looks like blob.)2. Is the relationship linear, quadratic, something else?3. Is the relationship strong (clear patterns) or weak ( fuzzy patterns)?Here are some examples: Thisdata comes from class.
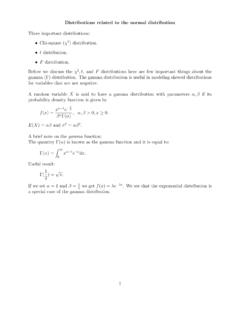
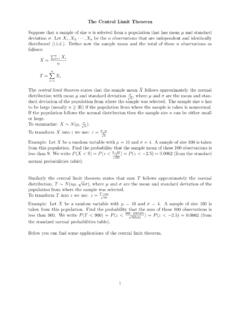
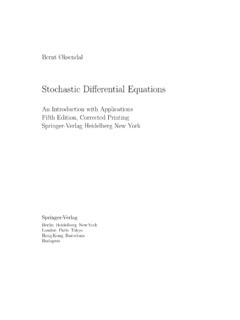
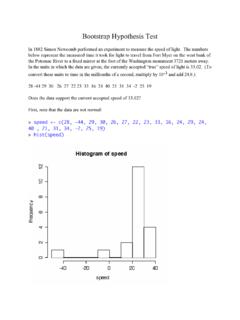
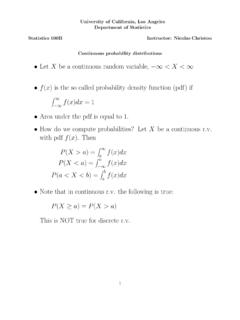
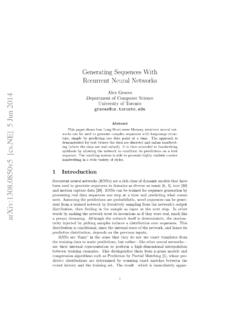
3 The picture comes from plotting each person s height and weight. Forexample ( 74, 180), (69, 175), (76, 170), etc. This is a positive relation, fairly weak, and possiblylinear. Theredoes not seem to be any relationship here. People of a given height can be any negative relation. Mortality decreases as per capita wine consumption increases. The relationis not linear. (A straight-line would be a poor description of the trend.) The trend is fairly shows the heights of girls at age 2 and later at age 18 (in cm). Below is height at age 2 andthen at fairly strong positive linear trend. However, it is not as strong as the positive linear trendbelow. Does this make sense?Some dealing with a relation, the x and y Variables have particular roles to play. The x(horizontal axis) variable represents the variable that explains what we see in y (the verticalaxis.)
4 Often, x is a quantity which we can change or have control over. Or at least, we want tosee how y reacts to different values of x. So x is usually called the independent or explanatoryvariable, and y the dependent or response variable. Another way to think about it, sometimes, isthat x is used to predict y. So x is something that comes before y in is why, for example, height at age 2 is on the x axis and height at age 18 on the want to know how what we learn about height at age 2 predicts height at a later it make sense, then, to have mortality on the x axis, and wine consumption on the y?Perhaps, but probably this would be an unusual arrangement. It s hard to imagine a situation inwhich someone says, "I ll tell you the death rate of a country, and you predict their wineconsumption." Probably for most medical purposes, since wine consumption is something that ischangeable, the arrangement shown above is summaryIt is a bit much to expect a single number to summarize a relation between two Variables .
5 And itis. However, it turns out that linear relations are quite prevalent in many studies, and even if arelation is not linear, there is often a way of making it so. For this reason, the numericalsummary we use applies only to linear assume we are talking about a linear relation. The correlation coefficient is a number thatmeasures the strength of a linear relation. It is represented by the letter r, and it has thesequalities:1) It is a number between -1 and 1 (inclusive).2) If it is negative, then the relation is a negative one (x goes up y goes down) and if positive,then the relation is ) If it is 0, then there is no linear ) The closer to +1 or -1, the stronger the are particular shapes associated with particular values of r. If r is 0, the scatterplot is ablob. If r = 1, then it is a straight line with positive slope.
6 If 0 < r < 1, then the scatterplot fallssomewhere in between a blob and a straight : this applies only to linear relations. If the relation is non-linear, r might be close to 0even if the relation is quite strong. This happens with quadratics, as you'll see measures things with respect to averages. If someone says "x and y are highly positivelycorrelated", this means that if x is above average, then y tends to be above average. If x is belowaverage, then y tends to be below average. So if height and weight are positively correlated, thismeans that people who are taller than average tend to be heavier than average. People who aretaller than average at age 2 tend to be taller than average at age correlations for the above graphs are:Height, Weight: r = , Height r = , Mortality: non-linear; don't calculate rHt2, Ht 9 r = , Ht 18, r = Rule of CorrelationsCorrelation does not imply cause-and-effectblanket sales in canada and brush fires in Australia are positively correlated.
7 Does buying ablanket cause a fire in Australia?The amount of damage at a fire is positively correlated with the number of fire engines that showup to put out the fire. Can damages be reduced by not sending fire trucks?Your age is negatively correlated with the distance of Halley's comet from the earth. When thecomet returns, will you grow younger?The bottom line is that confounding Variables prevent us from making a cause-and-effectconclusion. The best we can do is accept that we are Describing a relationship without knowingwhat makes the relationship happen, or if the relation is "real." Calculating rThere is a formula for calculating r. I don't expect you to memorize it, but you should know howto use it to find r for a list of pairs of numbers, and you must know what it we have to define a new obj