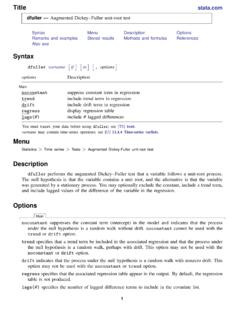
dfuller — Augmented Dickey–Fuller unit-root test
Augmented Dickey-Fuller test for unit root Number of obs = 87 Interpolated Dickey-Fuller Test 1% Critical 5% Critical 10% Critical Statistic Value Value Value Z(t) -1.318 -4.069 -3.463 -3.158 MacKinnon approximate p-value for Z(t) = 0.8834 As we might expect from economic theory, here we cannot reject the null hypothesis that log
Download dfuller — Augmented Dickey–Fuller unit-root test

Information
Domain:
Source:
Link to this page:
Documents from same domain

Syntax - Stata
www.stata.com2cluster kmeans and kmedians— Kmeans and kmedians cluster analysis Options Main k(#) is required and indicates that # groups are to be formed by the cluster analysis.

Syntax Description - Stata
www.stata.com2substr()— Extract substring Diagnostics In substr(s, b, l) and substr(s, b), if b describes a position before the beginning of the string or after the end, "" is returned.

Title stata.com generate — Create or change …
www.stata.comTitle stata.com generate — Create or change contents of variable SyntaxMenuDescriptionOptions Remarks and examplesMethods and formulasReferencesAlso see Syntax Create new variable generate type newvar

SyntaxDescriptionRemarks and examplesAlso see
www.stata.commacro— Macro definition and manipulation 3 Macro extended functions related to matrices rownamesjcolnamesjrowfullnamesjcolfullnames matname roweqjcoleq

Title stata.com graph box — Box plots
www.stata.comgraph box— Box plots 3 Menu Graphics > Box plot Syntax graph box yvars if in weight, options graph hbox yvars if in weight, options where yvars is a varlist options Description

Title stata
www.stata.comarea options — Options for specifying the look of special areas 3 Also see [G-2] graph dot — Dot charts (summary statistics)

www.stata.com
www.stata.com2cluster dendrogram— Dendrograms for hierarchical cluster analysis The height of the vertical lines and the range of the (dis)similarity axis give visual clues about the

Title stata.com putexcel — Export results to an Excel …
www.stata.computexcel— Export results to an Excel file 3 export options Description Main overwritefmt overwrite existing cell formatting when exporting new content

destring — Convert string variables to numeric ... - …
www.stata.comTitle stata.com destring — Convert string variables to numeric variables and vice versa SyntaxMenuDescription Options for destringOptions for tostringRemarks and …

Title stata.com gettoken — Low-level parsing
www.stata.comTitle stata.com gettoken — Low-level parsing SyntaxDescriptionOptionsRemarks and examplesAlso see Syntax gettoken emname1 emname2: emname3, parse("pchars") quotes qed(lmacname) match(lmacname) bind
Related documents
DEVELOPING HYPOTHESIS AND RESEARCH QUESTIONS
www.public.asu.eduexperimental test when possible”. (Eric Rogers, 1966) “A hypothesis is a conjectural statement of the relation between two or more variables”. (Kerlinger, 1956) “Hypothesis is a formal statement that presents the expected relationship between an independent and dependent variable.”(Creswell, 1994)
Hypothesis Testing - Duke University
www2.stat.duke.edu23.1 How Hypothesis Tests Are Reported in the News 1. Determine the null hypothesis and the alternative hypothesis. 2. Collect and summarize the data into a test statistic. 3. Use the test statistic to determine the p-value. 4. The result is statistically significant if the p-value is less than or equal to the level of significance.
Chapter 206 Two-Sample T-Test - Statistical Software
ncss-wpengine.netdna-ssl.comTwo-Sample T-Test Introduction This procedure provides several reports for the comparison of two continuous-data distributions, including confidence intervals for the difference in means, two-sample t-tests, the z-test, the randomization test, the Mann- ... For comparing two means, the basic null hypothesis is that the means are equal,
Type II Error and Power Calculations
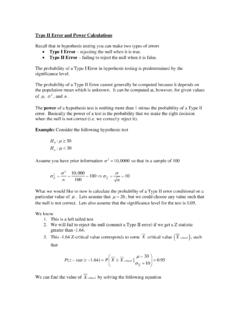
www.ssc.wisc.eduthe null is not correct. Lets also assume that the significance level for the test is 0.05. We know 1. This is a left tailed test 2. We will fail to reject the null (commit a Type II error) if we get a Z statistic greater than -1.64. 3. This -1.64 Z-critical value corresponds to some X critical value (Xcritical), such that 30 ( 1.64) | 0.95 ...
Chapter 5 Measurement Operational Definitions
uca.edu5 - 2 Operational Definitions An essential component of an operational definition is measurement. A simple and accurate definition of measurement is the assignment of numbers to a variable in which we are interested. These numbers will

Multiple Hypothesis Testing: The F-test
www.mattblackwell.orgtest, say, the hypothesis that some variable has no effect on the dependent variable. All we do is calculate a t-statistic for this null hypothesis and our data and see if that test statistic is unlikely under the null distribution (the Student’s t-distribution). Unfortunately, when we have more complicated hypotheses, this test no longer works.

Understanding the Dependent t Test
oak.ucc.nau.eduTHE DEPENDENT-SAMPLES t TEST PAGE 4 our example, t obt = 27.00 and t cv = 2.052, therefore, t obt > t cv – so we reject the null hypothesis and conclude that there is a statistically significant difference between the two conditions. That is, the average reaction time for the alcohol condition (M = 42.07) was significantly longer (slower) than the average reaction time for the no …