
Missing-data imputation
Missing-data imputation Missing data arise in almost all serious statistical analyses. In this chapter we discuss avariety ofmethods to handle missing data, including some relativelysimple approaches that can often yield reasonable results. We use as a running example the Social Indicators Survey, a telephone survey of New York City families ...
Download Missing-data imputation

Information
Domain:
Source:
Link to this page:
Documents from same domain

Lecture 15 Introduction to Survival Analysis
www.stat.columbia.eduLecture 15 Introduction to Survival Analysis BIOST 515 February 26, 2004 BIOST 515, Lecture 15
Two-way ANOVA and ANCOVA
www.stat.columbia.eduTwo-way ANOVA and ANCOVA In this tutorial we discuss fitting two-way analysis of variance (ANOVA), as well as, analysis of covariance (ANCOVA) models in R.

Multiple Linear Regression - Columbia University
www.stat.columbia.eduMultiple Linear Regression A regression with two or more explanatory variables is called a multiple regression. Rather than modeling the …

Sample size and power calculations - Columbia …
www.stat.columbia.eduCHAPTER 20 Sample size and power calculations 20.1 Choices in the design of data collection Multilevel modeling is typically motivated by features in …

One and Two-sample t-tests - Columbia University
www.stat.columbia.eduOne and Two-sample t-tests The R function t.test() can be used to perform both one and two sample t-tests on vectors of data. The function contains a variety of options and can be called as follows:

Statistics and Research Integrity - Columbia University
www.stat.columbia.eduEuropean Science Editing 13 February 2015; 41(1) Another important challenge was receiving fewer essays from Balkan authors than expected and convincing the referees

Linear Regression - Columbia University
www.stat.columbia.eduLinear Regression In this tutorial we will explore fitting linear regression models using STATA. We will also cover ways of re-expressing variables in a …

The Twentieth-Century Reversal: How Did the …
www.stat.columbia.eduGelman: The Twentieth-Century Reversal: How Did the Republican States Switch to the Democrats and Vice Versa? 3 of, and more …

Abandon Statistical Signi cance - Department of …
www.stat.columbia.eduAbandon Statistical Signi cance Blakeley B. McShane1, David Gal2, Andrew Gelman3, Christian Robert4, and Jennifer L. Tackett1 1Northwestern University, 2University of …

Colors in R - Columbia University
www.stat.columbia.educolor name color name gray8 gray9 gray10 gray11 gray12 gray13 gray14 gray15 gray16 gray17 gray18 gray19 gray20 gray21 gray22 gray23 gray24 gray25 gray26 gray27 gray28
Related documents
Data Conversion Handbook - Analog Devices
www.analog.comANALOG-DIGITAL CONVERSION 1. Data Converter History 2. Fundamentals of Sampled Data Systems 3. Data Converter Architectures 4. Data Converter Process Technology 5. Testing Data Converters 5.1 Testing DACs 5.2 Testing ADCs 6. Interfacing to Data Converters 7. Data Converter Support Circuits 8. Data Converter Applications 9. Hardware Design ...

AP-42, Appendix A : Miscellaneous Data And Conversion …
www3.epa.govMISCELLANEOUS DATA AND CONVERSION FACTORS 9/85 (Reformatted 1/95) Appendix A A-1. A-2 EMISSION FACTORS (Reformatted 1/95) 9/85. SOME USEFUL WEIGHTS AND MEASURES Unit Of Measure Equivalent grain 0.002 ounces gram 0.04 ounces ounce 28.35 grams kilogram 2.21 pounds pound 0.45 kilograms
Minutes to Decimal Conversion Chart
www.montgomerycountymd.govMinutes to Decimal Conversion Chart Below is a chart to help you convert minutes to decimals for use with MCtime. Minutes Decimals Minutes Decimals 1 0.02 31 0.52 2 0.03 32 0.53 3 0.05 33 0.55 4 0.07 34 0.57 5 0.08 35 0.58 6 0.10 36 0.60 7 0.12 37 0.62 8 0.13 38 0.63 9 0.15 39 0.65 10 0.17 40 0.67 11 0.18 41 0.68 12 0.20 42 0.70
Conversion Guide for SAP S/4HANA 2020
help.sap.com4.6 Cleaning Up Obsolete Data After the Conversion.....41 2 PUBLIC Conversion Guide for SAP S/4HANA 2020 Content. Document History Version Date Description 1.0 October 07, 2020 Version for SAP S/4HANA 2020 FPS00. 1.1 November 03, 2020 Added Best Practice guides to …

2012 Guidelines to Defra / DECC's GHG Conversion Factors ...
assets.publishing.service.gov.ukThese conversion factors allow activity data (e.g. litres of fuel used, number of miles driven, tonnes of waste sent to landfill) to be converted into kilograms of carbon dioxide equivalent (CO 2 e). CO 2 e is a universal unit of measurement that allows the global warming potential of different GHGs to be compared.

National Drug Code (NDC) Conversion Table
health.maryland.govindicated on packaging and the associated conversion to an 11-digit format, using the proper placement of a zero. The correctly formatted, additional “0” is in a bold font and underlined in the following example. Note that hyphens indicated below are used solely to illustrate the various formatting examples for the National Drug Code (NDC).
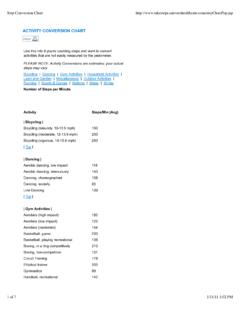
Step Conversion Chart - arhs-nc.org
www.arhs-nc.orgACTIVITY CONVERSION CHART Use this info if you're counting steps and want to convert activities that are not easily measured by the pedometer. PLEASE NOTE: Activity Conversions are estimates; your actual
PCF8591 8-bit A/D and D/A converter - NXP
www.nxp.comThe conversion result is stored in the ADC data register and awaits transmission. If the auto-increment flag is set, the next channel is selected. The first byte transmitted in a read cycle contains the conversion result code of the previous read cycle. After a POR condition, the first byte read is 80h.