
Problem Statement 1 - IBM
Stage 1 – Extract Wikipedia plots data from Wikipedia-data folder and try to construct a different and unbiased version of a story. Stage 2 – Use attention model to pin point various parts in the story and then debias those parts. Further show these nodes in an interactive visualization.
Download Problem Statement 1 - IBM

Information
Domain:
Source:
Link to this page:
Documents from same domain
Generating Test Cases From Use Cases - IBM
www.ibm.comGenerating Test Cases From Use Cases by Jim Heumann Requirements Management Evangelist Rational Software In many organizations, software testing accounts for 30 to 50 percent of software

IBM AND THE FUTURE OF MOVIES
www.ibm.com-1- IBM AND THE FUTURE OF MOVIES . WASHER: Welcome to an IBM podcast on the Future of Movies. I'm Tim Washer. Our guests today are Yair Landau, President of …
Cloud Services For Dummies, IBM Limited Edition
www.ibm.comIntroduction W elcome to Cloud Services For Dummies, IBM Limited Edition.Whether public, private, or hybrid, cloud computing is becoming an increasingly integral part of …

4Q 2015 Earnings Presentation - IBM
www.ibm.comwww.ibm.com/investor 2 Forward Looking Statements and Non-GAAP Information Certain comments made in this presentation may …
System i: Security Service tools user IDs and …
www.ibm.comSystem i Security Service tools user IDs and passwords Version 5 Release 4

IBM Business Conduct Guidelines
www.ibm.comIBM Business Conduct Guidelines 1 Contents Letter from the Chairman 1.0 Guiding Principles 1.1 Commitment to Integrity and Business Ethics 1.2 Using the Business Conduct Guidelines

IBM Storage Insights: Security Guide
www.ibm.comIBM Storage Insights Pr o and IBM Storage Insights ar e cloud service of ferings that ... Security certification: IBM Storage Insights, based on r egular audits, has ISO/IEC ... 4 IBM Storage Insights: Security Guide. Chapter 3. How is the metadata protected

www.ibm.com
www.ibm.comS Oracle WebLogic Server V/6X&CLr ...83 S Oracle WebLogic Server V/6X&CLr ..83 Z 15 B |nPdC .........85 dCN}i$ ..............85 dktTD~ ..............86 |nPgfN ...
Interconnect technology and Turbo Boost …
www.ibm.comIBM System x3550 M3 R2 servers include new Intel Xeon multicore processors with next-generation microarchitecture design featuring Quick Path Interconnect technology and Turbo Boost technology Table of contents 2 Overview 10 Publications 3 Key prerequisites 11 Technical information 3 Planned availability date 20 Terms and conditions 3 …
IBM System x3550 M3 - IBM - United States
www.ibm.comIBM Systems and SysteTechnology Group Hoja de especificaciones mx IBM System x3550 M3 Rendimiento informático óptimo en un diseño compacto Característicasprincipales
Related documents

Quadro Pascal P400 Data Sheet - Nvidia
www.nvidia.comTitle: Datasheet Quadro P400 Author: NVIDIA Corporation Subject: Tech specs of Quadro P400, 2 GB GDDR5, 256 CUDA core Pascal GPU Created Date: 5/25/2018 11:38:33 AM

ggmap: Spatial Visualization with ggplot2
journal.r-project.orgCONTRIBUTED RESEARCH ARTICLES 144 ggmap: Spatial Visualization with ggplot2 by David Kahle and Hadley Wickham Abstract In spatial statistics the ability to visualize data and models superimposed with their basic social landmarks and geographic context is invaluable. ggmap is a new tool which enables such visualization by combining the spatial information of …

A Step-by-Step Guide to Advanced Data Visualization
policyviz.comBasic Data Visualization Principles 6 . Basic Data Visualization Principles . This guide is not intended to be an introductory guide to best practices in data visualization. Instead, it is intended to show you how to extend the capabilities of Microsoft Excel so that you can create more and better visualizations.
Data Visualization
datax.berkeley.eduData visualization is the graphical representation of information and data. What are the advantages of data visualization? Makes for easier interpretation of patterns and trends as opposed to looking at data in a tabular/spreadsheet format. What makes for …
Data Visualization - Stats and R
statsandr.comfew components: a data set, a set of geoms—visual marks that represent data points, and a coordinate system. To display data values, map variables in the data set to aesthetic properties of the geom like size, color, and x and y locations. Graphical Primitives Data Visualization with ggplot2 Cheat Sheet

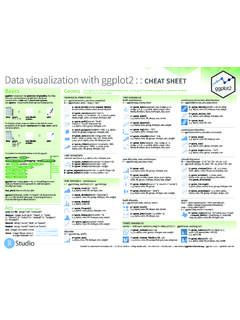
Data Visualization with ggplot2 : : CHEAT SHEET
www.maths.usyd.edu.auData Visualization with ggplot2 : : CHEAT SHEET ggplot2 is based on the grammar of graphics, the idea that you can build every graph from the same components: a data set, a coordinate system, and geoms—visual marks that represent data points.
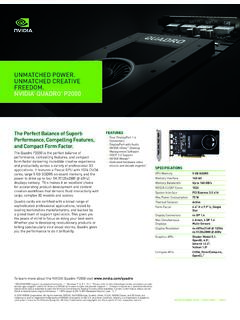
Datasheet Quadro P2000 - Nvidia
www.nvidia.comTitle: Datasheet Quadro P2000 Author: NVIDIA Corporation Subject: Tech specs of Quadro P2000, 5 GB GDDR5 memory, 1024 CUDA cores with Pascal GPU

NANODEGREE PROGRAM SYLLABUS Data Analysis and ...
d20vrrgs8k4bvw.cloudfront.netdata visualization and report design skills learned in the course while also challenging them to implement a variety of interactive features that can enhance the user experience. By the end of the project, students will have designed a detailed Power BI report

Visualization Solutions Selection Guide
literature.rockwellautomation.comVisualization products from Rockwell Automation comprise a suite of scalable HMI software and operator interface hardware that provide plant floor machine operators, supervisors, engi neers, and business managers a window to critical data and production and process information.