
Syntax - Stata
Model 427.990298 1 427.990298 Prob > F = 0.0005 Residual 489.873338 20 24.4936669 R-squared = 0.4663 Adj R-squared = 0.4396 Total 917.863636 21 43.7077922 Root MSE = 4.9491 mpg Coef. Std. Err. t P>|t| [95% Conf. Interval] weight -.010426 .0024942 -4.18 0.000 -.0156287 …
Download Syntax - Stata

Information
Domain:
Source:
Link to this page:
Documents from same domain

Syntax - Stata
www.stata.com2cluster kmeans and kmedians— Kmeans and kmedians cluster analysis Options Main k(#) is required and indicates that # groups are to be formed by the cluster analysis.

Syntax Description - Stata
www.stata.com2substr()— Extract substring Diagnostics In substr(s, b, l) and substr(s, b), if b describes a position before the beginning of the string or after the end, "" is returned.

Title stata.com generate — Create or change …
www.stata.comTitle stata.com generate — Create or change contents of variable SyntaxMenuDescriptionOptions Remarks and examplesMethods and formulasReferencesAlso see Syntax Create new variable generate type newvar

SyntaxDescriptionRemarks and examplesAlso see
www.stata.commacro— Macro definition and manipulation 3 Macro extended functions related to matrices rownamesjcolnamesjrowfullnamesjcolfullnames matname roweqjcoleq

Title stata.com graph box — Box plots
www.stata.comgraph box— Box plots 3 Menu Graphics > Box plot Syntax graph box yvars if in weight, options graph hbox yvars if in weight, options where yvars is a varlist options Description

Title stata
www.stata.comarea options — Options for specifying the look of special areas 3 Also see [G-2] graph dot — Dot charts (summary statistics)

www.stata.com
www.stata.com2cluster dendrogram— Dendrograms for hierarchical cluster analysis The height of the vertical lines and the range of the (dis)similarity axis give visual clues about the

Title stata.com putexcel — Export results to an Excel …
www.stata.computexcel— Export results to an Excel file 3 export options Description Main overwritefmt overwrite existing cell formatting when exporting new content

destring — Convert string variables to numeric ... - …
www.stata.comTitle stata.com destring — Convert string variables to numeric variables and vice versa SyntaxMenuDescription Options for destringOptions for tostringRemarks and …

Title stata.com gettoken — Low-level parsing
www.stata.comTitle stata.com gettoken — Low-level parsing SyntaxDescriptionOptionsRemarks and examplesAlso see Syntax gettoken emname1 emname2: emname3, parse("pchars") quotes qed(lmacname) match(lmacname) bind
Related documents
PENAL CODE TITLE 1. INTRODUCTORY PROVISIONS …
statutes.capitol.texas.gov(E) to harm the credit or business repute of any person; or (F) to take or withhold action as a public servant, or to cause a public servant to take or withhold action. PENAL CODE Statute text rendered on: 10/2/2021 - 4 - (10) "Conduct" means an act or omission and its

Preface - Cornell University
pi.math.cornell.eduen: an ncell, homeomorphic to the open ndisk Dn−∂Dn. In particular, D 0 and e 0 consist of a single point since R 0 ={0}. But S 0 consists of two points since it is ∂D 1 .

Tables of Constants for Control charts
web.mit.eduChart for Ranges (R) Chart for Moving Range (R) Median Charts Charts for Individuals CL X X ~ ~ = CL R = R CL X =X UCL X A R X 2 ~ ~ = + LCL X A R X 2 ~ ~ = − UCL R = D 4 R LCL R = D 3 R UCL X + E 2 R LCL X = X − E 2 R CL R = R UCL D R R = 4 LCL R = D 3 R 2 ~ A Institute of Quality and Reliability www.world-class-quality.com Control Chart ...

CHEMICAL ENGINEERING LABORATORY 3, CE 427 PACKED …
wwwcourses.sens.buffalo.edur (e) f e − ∆ ≡ 1 2 3 V L pg D f o c s p p Similar to7.19 in M & H. (1) Note that this equation cannot be derived directly by extrapolating the case of flow through a circular conduit since friction factor defined in both cases is different (see McCabe and Smith …
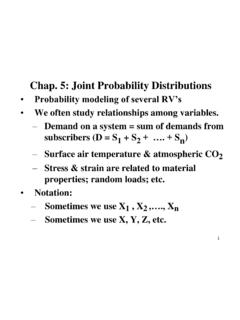
Chap. 5: Joint Probability Distributions
www.asc.ohio-state.edu1 Chap. 5: Joint Probability Distributions • Probability modeling of several RV‟s • We often study relationships among variables. – Demand on a system = sum of demands from subscribers (D = S 1 + S 2 + …. + S n) – Surface air temperature & atmospheric CO 2 – Stress & strain are related to material properties; random loads; etc.

Chapter 2: Simple Linear Regression
www.stat.purdue.eduR2 = 425.63910 427.79402 = 0.995, and thus about 99.5% of the variability in the ob-served values is explained by boiling point. In the below, we list some properties of R2. 1. The range of R2 is 0 ≤ R2 ≤ 1.

Summary of Benefits and Coverage: What this Plan Covers ...
api.realfile.rtsclients.comis: the plan at 1-855-808-3568. You may also contact the Office of the Superintendent of Insurance (OSI) at 1-855-427-5674. Other coverage options may be available to you too, including buying individual insurance coverage through the Health Insurance Marketplace. For more information about the Marketplace, visit www.bewellnm.com or call 1-833 ...

Stata: Software for Statistics and Data Science | Stata
www.stata.comModel 427.990298 1 427.990298 Prob > F = 0.0005 Residual 489.873338 20 24.4936669 R-squared = 0.4663 Adj R-squared = 0.4396 Total 917.863636 21 43.7077922 Root MSE = 4.9491 mpg Coefficient Std. err. t P>|t| [95% conf. interval] weight -.010426 .0024942 -4.18 0.000 -.0156287 -.0052232 _cons 48.9183 5.871851 8.33 0.000 36.66983 61.16676