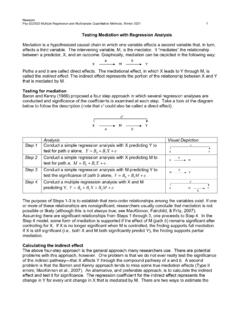
Testing Mediation with Regression Analysis
Psy 522/622 Multiple Regression and Multivariate Quantitative Methods, Winter 2021 1 . Testing Mediation with Regression Analysis . Mediation is a hypothesized causal chain in which one variable affects a second variable that, in turn, affects a third variable. The intervening variable, M, is the mediator. It “mediates” the relationship
Download Testing Mediation with Regression Analysis

Information
Domain:
Source:
Link to this page:
Documents from same domain
Unterrichtsmaterial & Arbeitsblätter
web.pdx.eduUnterrichtsmaterial und Arbeitsblätter für Lehrer in Mathematik 4/26/10 7:13 PM http://www.unterrichtsmaterial-schule.de/unterrichtsmaterialm.shtml Page 2 of 4
Determination of Calcium, Magnesium, and …
web.pdx.eduHardness can be determined by a number of methods including EDTA titration (as is done in CH 321) and atomic absorption and emission spectrophotometry.
Raman Spectroscopy Basics - Portland State …
web.pdx.eduRaman Basics page 1 of 5 …SEE the Future Introduction Raman spectroscopy is a spectroscopic technique based on inelastic scattering of …

Policy Success, Policy Failure and Grey Areas In …
web.pdx.eduPolicy Success, Policy Failure and Grey Areas In-Between ALLAN M CONNELL Government and International Relations, University of Sydney ABSTRACT Policy protagonists are keen to claim that policy is successful while
Exercises and Problems in Linear Algebra
web.pdx.eduAnton and Chris Rorres and Linear Algebra and its Applications [10] by Gilbert Strang are loaded with applications. If you are a student and nd the level at which many of the current beginning linear algebra
Distinguishing Between Random and Fixed
web.pdx.eduNewsom Psy 510/610 Multilevel Regression, Spring 2017 1 . Distinguishing Between Random and Fixed: Variables, Effects, and Coefficients
ANTH 103: INTRODUCTION TO SOCIAL/CULTURAL …
web.pdx.eduThis course introduces the student to branch of anthropology known as sociocultural anthropology. The texts, lectures, films, discussions, projects, and other assignments are The texts, lectures, films, discussions, projects, and other assignments are
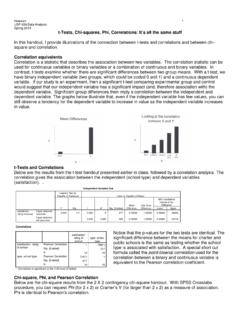
t-Tests, Chi-squares, Phi, Correlations: It’s all the …
web.pdx.eduNewsom 1 USP 634 Data Analysis Spring 2013 t-Tests, Chi-squares, Phi, Correlations: It’s all the same stuff . In this handout, I provide illustrations of the connection between t-tests and correlations and between chi-
Apparatus - Portland State University
web.pdx.eduWater Quality 1 - Spectrophotometric Determination of Iron in Drinking Water Introduction The safety of drinking water is a very important public health issue.
Simple Invoicing Desktop Database with MS …
web.pdx.eduSimple Invoicing Desktop Database with MS Access 2013 A Database Management System (DBMS) is a set of procedures and tools to store and retrieve information. The database itself is the stored information. The types of information stored in the database are de ned by the corresponding data structures. The database
Related documents
Regression Analysis with Cross-Sectional Data
www.swlearning.comregression analysis, including advanced functional form issues, data scaling, prediction, and goodness-of-fit. Chapter 7 explains how qualitative information can be incorporated into multiple regression models. Chapter 8 illustrates how to test for and correct the problem of heteroskedasticity, or
Chapter 12 Polynomial Regression Models - IIT Kanpur
home.iitk.ac.inRegression Analysis | Chapter 12 | Polynomial Regression Models | Shalabh, IIT Kanpur 2 The interpretation of parameter 0 is 0 E()y when x 0 and it can be included in the model provided the range of data includes x 0. If x 0 is not included, then 0 has no interpretation. An example of the quadratic model is like as follows: The polynomial models can be used to approximate a …
Backward Stepwise Regression - StatPlus
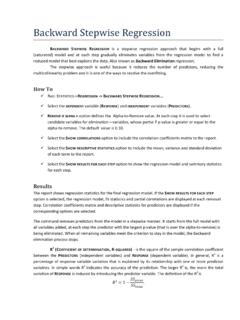
www.analystsoft.comBackward Stepwise Regression BACKWARD STEPWISE REGRESSION is a stepwise regression approach that begins with a full (saturated) model and at each step gradually eliminates variables from the regression model to find a reduced model that best explains the data. Also known as Backward Elimination regression.

Bland-Altman Plot and Analysis - NCSS
ncss-wpengine.netdna-ssl.comand Analysis Introduction The Bland-Altman (mean-difference or limits of agreement) plot and analysis is used to compare two measurements of the same variable. That is, it is a method comparison technique. For example, an expensive measurement system might be compared with a less expensive one or an intrusive measurement system might be
THE NHSN STANDARDIZED UTILIZATION RATIO (SUR)
www.cdc.govThe logistic regression model is the specific type of model that adjusts for factors significantly associated with NICU central line (CL) device use. At a high level, the model uses a set of fixed parameters (adjustment variables
Multiple Linear Regression - Johns Hopkins University
blackboard.jhu.edumultiple linear regression analysis. Review of lecture two weeks ago • Linear regression assumes a linear relationship between independent variable(s) and dependent variable • Linear regression allows us to predict an outcome based on one or several predictors
Regression Analysis - GitHub Pages
juejung.github.ioa. Correlation analysis b. Coefficient of correlation c. Covariance d. Regression analysis ____ 4. The residual is defined as the difference between: a. the actual value of y and the estimated value of y b. the actual value of x and the estimated value of x c. the actual value of y and the estimated value of x d. the actual value of x and the ...
LECTURE NOTES #6: Correlation and Regression
www-personal.umich.eduor way of thinking about regression, lends itself to answering different research questions. Using different perspectives on regression will show us the generality of the technique, which will help us solve new types of data analysis problems that we may encounter in our research. 1.Describing bivariate data.
Correlation and Regression Example solutions
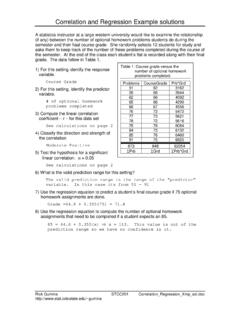
www.stat.colostate.eduRegression Analysis: CourseGrade versus Problems The regression equation is CourseGrade = 44.8 + 0.355 Problems Predictor Coef SE Coef T P Constant 44.827 4.344 10.32 0.000 Problems 0.35519 0.05898 6.02 0.000 S = 2.346 R-Sq = 78.4% R-Sq(adj) = 76.2% Figure 1: Regression plot for the grade versus homework study ...