The Binomial Probability Distribution
distribution. The mean value of a Bernoulli variable is = p, so the expected number of S’s on any single trial is p. Since a binomial experiment consists of n trials, intuition suggests that for X ~ Bin(n, p), E(X) = np, the product of the
Download The Binomial Probability Distribution

Information
Domain:
Source:
Link to this page:
Documents from same domain
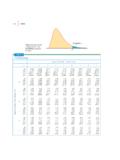
Integre Technical Publishing Co., Inc. …
www.stat.purdue.eduTables • T-13 Table entry for p is the critical value F∗ with probability p lying to its right. F* Probability p TABLE E F critical values (continued) Degrees of …
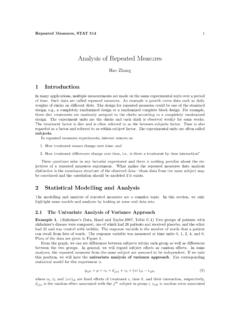
Analysis of Repeated Measures - Purdue University
www.stat.purdue.eduRepeated Measures, STAT 514 1 Analysis of Repeated Measures Hao Zhang 1 Introduction In many applications, multiple measurements are made on the same experimental units over a period
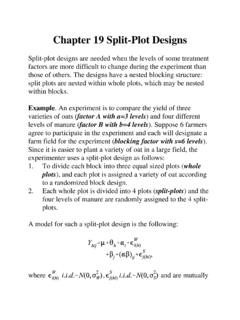
Chapter 19 Split-Plot Designs - Department of …
www.stat.purdue.eduChapter 19 Split-Plot Designs Split-plot designs are needed when the levels of some treatment factors are more difficult to change during the experiment than

Introduction to Genetic Association Studies
www.stat.purdue.eduTopic Introduction Introduction to Genetic Association Studies Cathryn M. Lewis and Jo Knight Genetic association studies are used to find candidate genes or genome regions that contribute to a
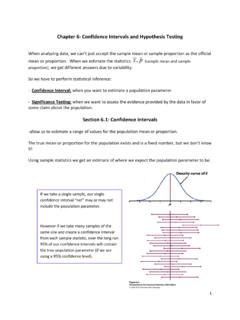
Chapter 6: Confidence Intervals and Hypothesis Testing
www.stat.purdue.eduState your conclusion about the data in a sentence, using the P‐value and/or comparing the P ‐value to a significance level for your evidence. STEP 1: State the null hypothesis H …
Description of controlled spike-in experiment
www.stat.purdue.eduDescription of controlled spike-in experiment September 19, 2011 1 Experimental design The experiment aimed at evaluating the ability of signi cance analysis to detect known fold changes, as well
CV with Publications
www.stat.purdue.eduCurriculum Vitae S.V.N. Vishwanathan Teaching Selected Graduate Courses 2015 Advanced Machine Learning 2014 { 2015 Analysis of Algorithms 2011 { 2014 Introduction to Computing for Statisticians

6 Finite Sample Theory of Order Statistics and Extremes
www.stat.purdue.edu6 Finite Sample Theory of Order Statistics and Extremes The ordered values of a sample of observations are called the order statistics of the sample, and the
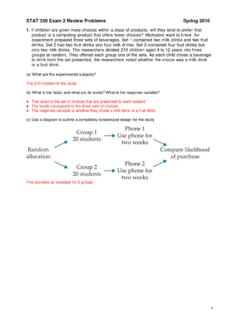
STAT 350 Exam 2 Review Problems Spring 2016
www.stat.purdue.eduSTAT 350 Exam 2 Review Problems Spring 2016 3 2. A random sample of 26 offshore oil workers took part in a simulated escape exercise, and their times (sec) to complete the escape are recorded. The sample mean is 370.69 sec and the sample standard deviation is 24.36 sec. Construct a 95% lower confidence bound on the true average escape time.

Mixed Models - Purdue University
www.stat.purdue.edu1 Introduction In many experimental design situations, one or more of the factors in the study may be random factors. That is, the levels of those factors are actually a sample from a larger population of levels and inferences are desired
Related documents

Bernoulli Distribution - University of Chicago
galton.uchicago.eduBernoulli distribution (with parameter µ) – X takes two values, 0 and 1, with probabilities p and 1¡p – Frequency function of X p(x) = ‰ µx(1¡µ)1¡x for x 2 f0;1g 0 otherwise – Often: X = ‰ 1 if event A has occured 0 otherwise Example: A = blood pressure above 140/90 mm HG. Distributions, Jan 30, 2003 - 1 -

Module 7 Simple Beam Theory - Massachusetts Institute of ...
web.mit.eduBernoulli assumptions: Cross sections of the beam do not deform in a signi cant manner under the application of transverse or axial loads and can be assumed as rigid Concept Question 7.1.1. With reference to Figure 7.1, 1.what is the main implication of this assumption on the kinematic description (overall displacement eld) of the cross section? 91

Bernoulli distribution X - William & Mary
www.math.wm.eduThe Bernoulli distribution is associated with the notion of a Bernoulli trial, which is an experiment with two outcomes, generically referred to as success (x =1) and failure (x =0). The cumulative distribution function of X ∼Bernoulli(p)is

Solved Problems - University of Texas at Austin
web.ma.utexas.eduChapter 14 Solved Problems 14.1 Probability review Problem 14.1. Let Xand Y be two N 0-valued random variables such that X= Y+ Z, where Zis a Bernoulli random variable with parameter p2(0;1), independent of Y.
Engineering Bernoulli Equation - Clarkson University
web2.clarkson.eduIn laminar flow, the velocity distribution across the cross-section must be accommodated in the kinetic energy calculation. In that case, we use the average velocities at the inlet and exit, but multiply the kinetic energy terms on each side of the Engineering Bernoulli Equation by a correction factor

Poisson and Normal Distributions
www.cis.rit.eduPoisson Distribution • The Poisson∗ distribution can be derived as a limiting form of the binomial distribution in which n is increased without limit as the product λ =np is kept constant. • This corresponds to conducting a very large number of Bernoulli trials with the probability p of success on any one trial being very small. • The Poisson distribution can also be derived …

Chapter 5 An Introduction to Discrete Probability
www.cis.upenn.eduTo be fair, Jacob Bernoulli, Abraham de Moivre, Pafnuty Chebyshev, Alek- ... Remark: Even though the term probability distribution is commonly used, this is not a good practice because there is also a notion of (cumulative) distribution func-

Principles of Flight: Foam Wing (Grades K-12)
www.nasa.govBernoulli Principle for all participants, but those in the 5th – 12th grades may engage in a brief discussion ... The pressure distribution on the laminar flow wing is more uniform since the camber of the wing from the leading edge to the point of maximum thickness is more
The Binomial Distribution
www3.nd.eduB. A binomial distribution gives us the probabilities associated with independent, repeated Bernoulli trials. In a binomial distribution the probabilities of interest are those of receiving a certain number of successes, r, in n independent trials each having only two possible outcomes and the same probability, p, of success.