The Binomial Probability Distribution
The Binomial Random Variable and Distribution In most binomial experiments, it is the total number of S’s, rather than knowledge of exactly which trials yielded S’s, that is of interest. Definition The binomial random variable X associated with a binomial experiment consisting of n trials is defined as X = the number of S’s among the n trials
Download The Binomial Probability Distribution

Information
Domain:
Source:
Link to this page:
Documents from same domain
Integre Technical Publishing Co., Inc. …
www.stat.purdue.eduTables • T-13 Table entry for p is the critical value F∗ with probability p lying to its right. F* Probability p TABLE E F critical values (continued) Degrees of …
Analysis of Repeated Measures - Purdue University
www.stat.purdue.eduRepeated Measures, STAT 514 1 Analysis of Repeated Measures Hao Zhang 1 Introduction In many applications, multiple measurements are made on the same experimental units over a period
Chapter 19 Split-Plot Designs - Department of …
www.stat.purdue.eduChapter 19 Split-Plot Designs Split-plot designs are needed when the levels of some treatment factors are more difficult to change during the experiment than

Introduction to Genetic Association Studies
www.stat.purdue.eduTopic Introduction Introduction to Genetic Association Studies Cathryn M. Lewis and Jo Knight Genetic association studies are used to find candidate genes or genome regions that contribute to a
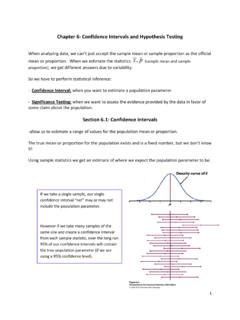
Chapter 6: Confidence Intervals and Hypothesis Testing
www.stat.purdue.eduState your conclusion about the data in a sentence, using the P‐value and/or comparing the P ‐value to a significance level for your evidence. STEP 1: State the null hypothesis H …
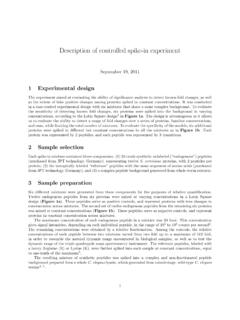
Description of controlled spike-in experiment
www.stat.purdue.eduDescription of controlled spike-in experiment September 19, 2011 1 Experimental design The experiment aimed at evaluating the ability of signi cance analysis to detect known fold changes, as well
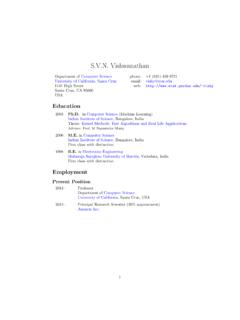
CV with Publications
www.stat.purdue.eduCurriculum Vitae S.V.N. Vishwanathan Teaching Selected Graduate Courses 2015 Advanced Machine Learning 2014 { 2015 Analysis of Algorithms 2011 { 2014 Introduction to Computing for Statisticians

6 Finite Sample Theory of Order Statistics and Extremes
www.stat.purdue.edu6 Finite Sample Theory of Order Statistics and Extremes The ordered values of a sample of observations are called the order statistics of the sample, and the
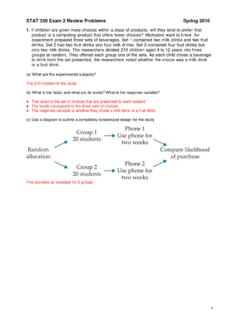
STAT 350 Exam 2 Review Problems Spring 2016
www.stat.purdue.eduSTAT 350 Exam 2 Review Problems Spring 2016 3 2. A random sample of 26 offshore oil workers took part in a simulated escape exercise, and their times (sec) to complete the escape are recorded. The sample mean is 370.69 sec and the sample standard deviation is 24.36 sec. Construct a 95% lower confidence bound on the true average escape time.

Mixed Models - Purdue University
www.stat.purdue.edu1 Introduction In many experimental design situations, one or more of the factors in the study may be random factors. That is, the levels of those factors are actually a sample from a larger population of levels and inferences are desired
Related documents

Binomial Distribution - University of Wisconsin–Madison
pages.stat.wisc.eduThe Binomial Distribution. The binomial distribution is applicable for counting the number of out-comes of a given type from a prespeci ed number n independent trials, each with two possible outcomes, and the same probability of the outcome of interest, p. The distribution is completely determined by n and p. The probability mass function is de ...

Table 1 Binomial distribution — probability function
www.utstat.toronto.eduStatistical Tables for Students Binomial Table 1 Binomial distribution — probability function p x 0.01 0.05 0.10 0.15 0.20 0.25 0.300.35 0.400.45 0.50

Negative Binomial Regression Models and Estimation …
www.icpsr.umich.edudistribution was developed to account for over-dispersion that is commonly observed in discrete or count data (Lord et al., 2005). It became very popular because the conjugate distribution (same family of functions) has a closed form and leads to the negative binomial distribution. As discussed by Cook
Notes on the Negative Binomial Distribution
www.johndcook.combinomial distribution that makes the connection with the Poisson more ex-plicit. Suppose Xj is a Poisson random variable and is a gamma( ; ) random variable. We create a new kind of random variable by starting with a Poisson but making it more variable by allowing the mean parameter to itself be random. P(X= x) = 1 ( ) Z 1 0

The geometric distribution - Math
www.math.utah.eduThe Poisson distribution 57 The negative binomial distribution The negative binomial distribution is a generalization of the geometric [and not the binomial, as the name might suggest]. Let us fix an integer) ≥ 1; then we toss a!-coin until the)th heads occur. Let X) denote the total number of tosses. Example 4 (The negative binomial ...

Worksheet: Binomial Distribution
www.npsd.k12.nj.usWorksheet: Binomial Distribution Multiple Choice Identify the letter of the choice that best completes the statement or answers the question. ____ 1. Which of the following is not a property of a Binomial Experiment? a. All trials are identical. b. Each trial has only two possible outcomes. c. The probability of success may change from trial to ...

Table 4 Binomial Probability Distribution
www.sjsu.eduTable 4 Binomial Probability Distribution Cn,r p q r n−r This table shows the probability of r successes in n independent trials, each with probability of success p ...
The Binomial Distribution
www3.nd.eduIn a binomial distribution the probabilities of interest are those of receiving a certain number of successes, r, in n independent trials each having only two possible outcomes and the same probability, p, of success. So, for example, using a binomial distribution, we can determine the probability of getting 4 heads in 10 coin tosses.