
The Box-Jenkins Method
where is the order of differencing. This is known as the d ARIMA(p,d,q) model. 2. Fit a least squares trend and fit the Box-Jenkins model to the residuals. If the model exhibits an occasional change of mean, first differences will result in a stationary model.
Download The Box-Jenkins Method

Information
Domain:
Source:
Link to this page:
Documents from same domain

Mixed Models - Repeated Measures - Statistical …
ncss-wpengine.netdna-ssl.comMixed Models – Repeated Measures Introduction ... analysis, and the amount of data available for the analysis. When more than one fixed factor may influence the

Repeated Measures Analysis - NCSS
ncss-wpengine.netdna-ssl.comThis section provides the technical details of the repeated measures designs that can be analyzed by PASS. Earlier ... Repeated Measures Analysis ...

Chapter 469 Decomposition Forecasting - NCSS
ncss-wpengine.netdna-ssl.comChapter 469 Decomposition Forecasting Introduction Classical time series decomposition separates a time series into five components: mean, long-range trend, seasonality, cycle, and randomness. The decomposition model is Value = (Mean) x (Trend) x (Seasonality) x (Cycle) x (Random).

Chapter 575 Probit Analysis - Statistical Software
ncss-wpengine.netdna-ssl.comChapter 575 Probit Analysis Introduction Probit Analysis is a method of analyzing the relationship between a stimulus (dose) and the quantal (all or nothing) response. Quantitative responses are almost always preferred, but in many situations they are not practical. In these cases, it is only possible to determine if a certain response (such as ...

Chapter 720 Probit Analysis - Statistical Software
ncss-wpengine.netdna-ssl.comChapter 720 Probit Analysis. Introduction . Probit and logit analysis may be used for comparative LD. 50. studies for testing the efficacy of drugs designed to prevent lethality. This program module presents calculates power and sample size using the methodology outlined

Chapter 311 Stepwise Regression - Statistical Software
ncss-wpengine.netdna-ssl.comNCSS Statistical Software NCSS.com © NCSS, LLC. All Rights Reserved.

Chapter 208 Paired T-Test - NCSS
ncss-wpengine.netdna-ssl.comNCSS Statistical Software NCSS.com Paired T-Test 208-6 © NCSS, LLC. All Rights Reserved. Tests Alpha Alpha is the significance leve l used in the hypothesis tests.

Multivariate Analysis of Variance (MANOVA)
ncss-wpengine.netdna-ssl.comNCSS Statistical Software NCSS.com Multivariate Analysis of Variance (MANOVA) 415-4 © NCSS, LLC. All Rights Reserved. Assumptions and Limitations

Chapter 194 Normality Tests - NCSS
ncss-wpengine.netdna-ssl.comNCSS Statistical Software NCSS.com © NCSS, LLC. All Rights Reserved.

Distribution Weibull Fitting - NCSS
ncss-wpengine.netdna-ssl.comDistribution (Weibull) Fitting Introduction This procedure estimates the parameters of the exponential, extreme value, logistic, log-logistic, lognormal, normal, and Weibull probability distributions by maximum likelihood. It can fit complete, right censored, left censored, interval censored (readou t), and grouped data values.
Related documents
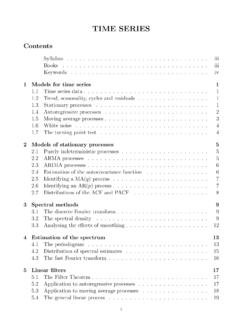
TIME SERIES - University of Cambridge
www.statslab.cam.ac.ukautocorrelations etc., then time-domain model fitting including autoregressive and moving average processes, spectral methods, and some discussion of the effect of time series correlations on other kinds of statistical inference, such as the estimation of means and regression coefficients. Books 1.
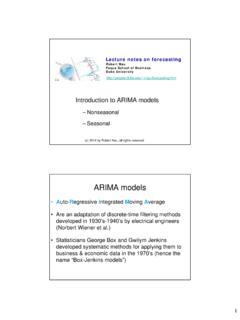
Slides on ARIMA models--Robert Nau
people.duke.edu3 Construction of an ARIMA model 1. Stationarize the series, if necessary, by differencing (& perhaps also logging, deflating, etc.) 2. Study the pattern of autocorrelations and partial autocorrelations to determine if lags of the stationarized series and/or lags of the forecast errors should be included

Interrupted Time Series Analysis Using STATA* Professor ...
www.jrsa.org• ARIMA is designed to operate with normally distributed outcome variables (similar to OLS regression) through the use of a Gaussian function • ARIMA assumes that model residuals (random shock components) are NORMALLY DISTRIBUTED. This is a …

The ARIMA Procedure
dms.umontreal.caARIMA model includes other time series as input variables, the model is sometimes referred to as an ARIMAX model. Pankratz (1991) refers to the ARIMAX model as dynamic regression. The ARIMA procedure provides a comprehensive set of tools for univariate time se-ries model identification, parameter estimation, and forecasting, and it offers great

Enhancing the Locality and Breaking the Memory …
proceedings.neurips.ccOne of the most prominent models is ARIMA [15]. Its statistical properties as well as the well-known Box-Jenkins methodology [16] in the model selection procedure make it the first attempt for practitioners. However, its linear assumption and limited scalability make it unsuitable for large-scale forecasting tasks.

Time Series Cheat Sheet - raw.githubusercontent.com
raw.githubusercontent.compredict(arima_model, number_to_predict) Forecasting future observations given a fitted ARMA model predict(): Predict future observations given a fitted ARMA model Plot Predicted values and Confidence Interval: fit<-predict(arima_model, number_to_predict) ts.plot(data,

中枢性尿崩症の診断の update
www.yamaguchi-endocrine.org2) Arima H, Azuma Y, et al.: Central diabetes insipidus. Nagoya J Med Sci.;78(4):349-358. 2016 3) Hagiwara D, Arima H, et al. : Arginine vasopressin neuronal loss results from autophagy-associated cell death in a mouse model for familial neurohypophysial diabetes insipidus. Cell Death Dis.;5:e1148.2014

The Moving Average Models MA(1) and MA(2)
mcs.utm.utoronto.canot. Thus if j j<1, model A is said to be invertible whereas model B is not. The imposition of the invertibility condition ensures that there is a unique MA process for a given autocorrelation function. Al Nosedal University of Toronto The Moving Average Models MA(1) and MA(2) February 5, 2019 21 / 47