Tutorials
Exercise 3: Creating a Composite Volume Calculation . . . . . . 110 Tutorial: Visualizing Surface Data . . . . . . . . . . . . . . . . . . . . 111
Download Tutorials

Information
Domain:
Source:
Link to this page:
Documents from same domain
Conceptual Design Modeling in Autodesk Revit …
images.autodesk.comCONCEPTUAL DESIGN MODELING IN AUTODESK REVIT ARCHITECTURE 2010 Although these results might be ideal for the developer, they leave much to be desired
Tutorials - Autodesk
images.autodesk.comExercise 2: Changing the Style of a Point Group . . . . . . . . . . 32 Exercise 3: Changing Point Group Display Order . . . . . . . . . 33
AutoSketch 10 Getting Started - Autodesk
images.autodesk.com2 | Chapter 1 Installation Contents of the AutoSketch Package AutoSketch includes the following: AutoSketch disc AutoSketch Getting Started (this guide) Create and Trim Entities (online tutorial) Create a Birdhouse Drawing (online tutorial) Create and Office Layout Drawing (online tutorial) Advanced Exercises (online tutorial) System Requirements
Best Practices - Autodesk
images.autodesk.comIn addition to what this guide contains, you will find best practices in the AutoCAD Civil 3D User’s Guide and Moving from Land Desktop to C3D. 1 1. ... your drawings, use customized AutoCAD Civil 3D templates. 2 3. Specify a template to use with the QNEW Command When you start AutoCAD Civil 3D using the imperial profile, the default ...
3D: Designing Competitive Advantage - Autodesk
images.autodesk.com3D: Designing Competitive Advantage ... between 2D Drawing and 3D Modeling Technology? Design engineers most often are focused on two major tasks: design and/or documentation. The primary difference between 2D and 3D technology is apparent in the amount of time designers
Tutorials: Lighting - Autodesk
images.autodesk.comShadow creation and definition. Nighttime illumination using adjustable photometric lights. Realistic scene illumination through use of Final Gather. Photon control for effective distribution of light energy. Lighting and Rendering the Villa in Daylight In this tutorial, …
AutoCAD道場 ACPE AutoCAD - images.autodesk.com
images.autodesk.com攻略の; 3 . ステップアプローチ 15:15-16:10 その異尺度対応、誤解してますよ!
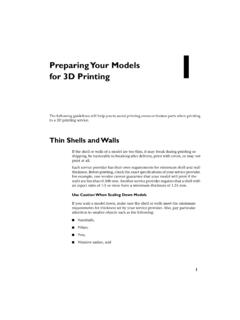
Preparing Your Models for 3D Printing
images.autodesk.comWires. This model of a house was scaled down. As a result, the roof of the model was too thin and it cracked. Structural Problems Models that have a large mass on top or a slender stem or base may break
A framework for implementing a BIM business …
images.autodesk.com1 ECT TAME A framework for implementing a BIM business transformation There are few experiences that test the mettle of corporate leadership like implementing radical ...
Getting Started with AutoCAD® Structural Detailing, Steel ...
images.autodesk.comAutoCAD® Structural Detailing 2011. Getting Started with AutoCAD® Structural Detailing, Steel module
Related documents
SPSS Step-by-Step Tutorial: Part 1 - DataStep
www.datastep.comCreating the data definitions: the variable view 13 Variable types 13. 4 SPSS Step-by-Step ... analyzing, and presenting data. Its statistical capabilities ... The data for this tutorial is available on floppy disk (if you received this tutorial as part of a class) and on the Internet. Use one of …

R Programming - Tutorialspoint
www.tutorialspoint.comThis tutorial is designed for software programmers, statisticians and data miners who are looking forward for developing statistical software using R programming. If you are trying to understand the R programming language as a beginner, this tutorial will give you

An Introduction to the WEKA Data Mining System
cs.ccsu.eduClassification – creating models (hypotheses) Mapping (independent attributes -> class) Inferring rudimentary rules - OneR 3/7 4/14 1/7 high -> no normal -> yes humidity 2/8 5/14 3/5 false -> yes true -> no windy 2/4 5/14 2/6 1/4 hot -> no mild -> yes cool -> yes temperature 2/5 4/14 0/4 2/5 sunny -> no overcast -> yes rainy -> yes outlook ...

NI Vision Assistant Tutorial
neurophysics.ucsd.eduNI Vision Assistant Tutorial viii ni.com Related Documentation The following list includes additional documents that you might find helpful as you work through this tutorial: • IMAQ Vision Concepts Manual—Installs with Vision Assistant and contains vision conceptual information. Refer to this document if you are new to Vision.

Creating a Training Strategy and Evaluating Effectiveness
www.icmi.comstep in the process involves analyzing current performance and identifying future objectives. For example, if a new product or service will be introduced in six months, determine what knowledge, skills and abilities. ICMI Tutorial Creating a Training Strategy and …
DIPS Tutorial - Rocscience Inc.
www.rocscience.comDips Plotting, Analysis and Presentation of Structural Data Using Spherical Projection Techniques User’s Guide 1989 - 2002 Rocscience Inc.

About the Tutorial
www.tutorialspoint.comIn this tutorial, you will understand these PivotTable features in detail along with examples. By the time you complete this tutorial, you will have sufficient knowledge on PivotTable features that can get you started with exploring, analyzing, and reporting data based on the requirements. Creating a PivotTable

Tableau Tutorial - RxJS, ggplot2, Python Data Persistence ...
www.tutorialspoint.comAbout the Tutorial Tableau is a Business Intelligence tool for visually analyzing the data. Users can create and distribute an interactive and shareable dashboard, which depict the trends, variations, and density of the data in the form of graphs and charts. Tableau can connect to files, relational and Big Data sources to acquire and process data.