
Using Excel, Chapter 8: Hypothesis Testing - One Sample
Chapter 8.2 - Hypothesis Testing About a Proportion Notation { Test Statistic = z ^p = p^ p q pq n { Signi cance Level = (in decimal form) { Critical Values = z or z =2 Finding Critical Values Here we use the NORM.S.INV function. NORM.S.INV stands for the inverse of the standard normal distribution (z-distribution).
Download Using Excel, Chapter 8: Hypothesis Testing - One Sample

Information
Domain:
Source:
Link to this page:
Documents from same domain
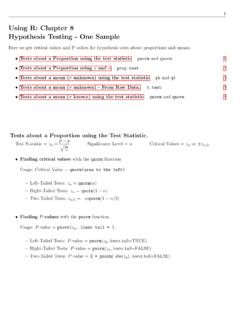
Using R: Chapter 8 Hypothesis Testing - One Sample
cosmosweb.champlain.eduUsing R: Chapter 8 Hypothesis Testing - One Sample Here we get critical values and P-values for hypothesis tests about proportions and means. Tests about a Proportion using the test statistic pnorm and qnorm. 1 Tests about a Proportion using xand n prop.test 2 Tests about a mean (˙unknown) using the test statistic pt and qt 3

Using SPSS, Chapter 8: Hypothesis Testing - One Sample
cosmosweb.champlain.eduChapter 8.3 - Hypothesis Tests About a Mean: ˙Not Known 1.Open or create your data. It must be in the form of rows=cases and columns=variables. SPSS can not be used with only the summarizing statistics (mean, standard deviation, sample size). Below left is the sample data. The sample mean is 38.6 and the sample standard deviation is 8.5. 2.

Using SPSS, Chapter 9: Hypothesis Testing - Two Samples
cosmosweb.champlain.eduChapter 9.2 - Hypothesis Tests for Two Means: Independent Data 4 SPSS does this really well but you do need the raw data1. Click here for online calculators that work well with summary statistics. Chapter 9.3 - Hypothesis Tests for Two Proportions 6 SPSS doesn’t do this the same way it is done in the book.

Using R: Frequency Distributions, Histograms, Scatterplots ...
cosmosweb.champlain.eduThen we created a relative and cumulative frequency table from this. Frequency Distribution: Males Scores Frequency 30 - 39 1 40 - 49 3 50 - 59 5 60 - 69 9 70 - 79 6 80 - 89 10 90 - 99 8 Relative Frequency Distribution: Males Relative Scores 30 - 39 2.4% 40 - 49 7.1% 50 - 59 11.9% 60 - 69 21.4% 70 - 79 14.3% 80 - 89 23.8% 90 - 99 19.0% ...

Using R, Chapter 6: Normal Distributions pnorm and …
cosmosweb.champlain.edu1 Using R, Chapter 6: Normal Distributions The pnorm and qnorm functions. Getting probabilities from a normal distribution with mean and standard deviation ˙

Using the TI-83/84 Plus Chapter 8: Hypothesis Testing ...
cosmosweb.champlain.eduChapter 8: Hypothesis Testing - One Sample Here we see how to use the TI 83/84 to conduct hypothesis tests about proportions and means. The software will calculate the test statistic and the P-value for the test statistic. It does not give you the critical value.
A Collection of Multiple-Choice Cumulative Questions In …
cosmosweb.champlain.eduA Collection of Past Questions Organized by Chapter Chapter 1: Sampling, Levels of Measurement, Percentages 1.A random sample is one with which characteristic? (A)Its members are chosen haphazardly. answer: (B)Every member of the population has an equal chance of being chosen for the sample.
Related documents

Using Your TI-83/84 Calculator for Hypothesis Testing: The ...
users.rowan.eduUsing Your TI-83/84 Calculator for Hypothesis Testing: The 1-Proportion z Test Dr. Laura Schultz The 1-proportion z test is used to test hypotheses regarding population proportions. This handout will take you through one of the examples we will be considering during class.

Hypothesis Testing with z Tests - University of Michigan
www-personal.umd.umich.eduwill reject the null hypothesis (cutoffs) p levels (α): Probabilities used to determine the critical value 5. Calculate test statistic (e.g., z statistic) 6. Make a decision Statistically Significant: Instructs us to reject the null hypothesis because the pattern in the data differs from whldbhlhat we would expect by chance alone.
Using R: Chapter 8 Hypothesis Testing - One Sample
cosmosweb.champlain.eduUsing R: Chapter 8 Hypothesis Testing - One Sample Here we get critical values and P-values for hypothesis tests about proportions and means. Tests about a Proportion using the test statistic pnorm and qnorm. 1 Tests about a Proportion using xand n prop.test 2 Tests about a mean (˙unknown) using the test statistic pt and qt 3

Chapter 6 Hypothesis Testing - University of Pittsburgh
sites.pitt.eduAn Alternative Decision Rule using the p - value Definition The p-value is defined as the smallest value of α for which the null hypothesis can be rejected. If the p-value is less than or equal to α ,we reject the null hypothesis (p ≤ α) If the p-value is greater than α ,we do not reject the null hypothesis (p > α)

Hypothesis Testing Cheat Sheet - QI Macros
www.qimacros.comThree Hypothesis Testing Methods 1. Classical: Compare a test statistic to a critical value. 2. p value: Probability of a test statistic being contrary to the null hypothesis. 3. Confidence Interval: Is the test statistic between or outside of the confidence interval. Hypothesis testing can be used in businesses to identify differences be-
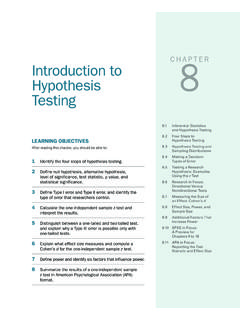
Introduction to Hypothesis Testing
www.sagepub.comand Hypothesis Testing 8.2 Four Steps to Hypothesis Testing 8.3 Hypothesis Testing and Sampling Distributions 8.4 Making a Decision: 8.5 Testing a Research Using the z Test 8.6 Research in Focus: Directional Versus Nondirectional Tests 8.7 Measuring the Size of an Effect: Cohen’s d 8.8 Effect Size, Power, and Sample Size
Hypothesis Testing
www.sci.utah.eduProperties of hypothesis testing 1. and are related; decreasing one generally increases the other. 2. can be set to a desired value by adjusting the critical value. Typically, is set at 0.05 or 0.01. 3.Increasing ndecreases both and . 4. decreases as the distance between the true value and
Hypothesis Testing - Duke University
www2.stat.duke.edu23.1 How Hypothesis Tests Are Reported in the News 1. Determine the null hypothesis and the alternative hypothesis. 2. Collect and summarize the data into a test statistic. 3. Use the test statistic to determine the p-value. 4. The result is statistically significant if the p-value is less than or equal to the level of significance.