
Using Excel, Chapter 8: Hypothesis Testing - One Sample
However, once you calculate the test statistic, Excel can get the critical values and the P-values needed to complete the test. The functions used to get critical values and P-values are demonstrated here. Chapter 8.2 - Hypothesis Testing About a Proportion 2 The functions demonstrated here use the standard normal (z) distribution.
Download Using Excel, Chapter 8: Hypothesis Testing - One Sample

Information
Domain:
Source:
Link to this page:
Documents from same domain
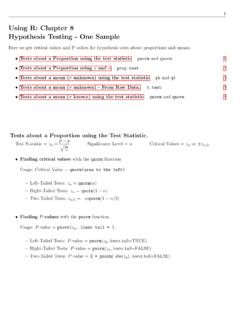
Using R: Chapter 8 Hypothesis Testing - One Sample
cosmosweb.champlain.eduUsing R: Chapter 8 Hypothesis Testing - One Sample Here we get critical values and P-values for hypothesis tests about proportions and means. Tests about a Proportion using the test statistic pnorm and qnorm. 1 Tests about a Proportion using xand n prop.test 2 Tests about a mean (˙unknown) using the test statistic pt and qt 3

Using SPSS, Chapter 8: Hypothesis Testing - One Sample
cosmosweb.champlain.eduChapter 8.3 - Hypothesis Tests About a Mean: ˙Not Known 1.Open or create your data. It must be in the form of rows=cases and columns=variables. SPSS can not be used with only the summarizing statistics (mean, standard deviation, sample size). Below left is the sample data. The sample mean is 38.6 and the sample standard deviation is 8.5. 2.

Using SPSS, Chapter 9: Hypothesis Testing - Two Samples
cosmosweb.champlain.eduChapter 9.2 - Hypothesis Tests for Two Means: Independent Data 4 SPSS does this really well but you do need the raw data1. Click here for online calculators that work well with summary statistics. Chapter 9.3 - Hypothesis Tests for Two Proportions 6 SPSS doesn’t do this the same way it is done in the book.

Using R: Frequency Distributions, Histograms, Scatterplots ...
cosmosweb.champlain.eduThen we created a relative and cumulative frequency table from this. Frequency Distribution: Males Scores Frequency 30 - 39 1 40 - 49 3 50 - 59 5 60 - 69 9 70 - 79 6 80 - 89 10 90 - 99 8 Relative Frequency Distribution: Males Relative Scores 30 - 39 2.4% 40 - 49 7.1% 50 - 59 11.9% 60 - 69 21.4% 70 - 79 14.3% 80 - 89 23.8% 90 - 99 19.0% ...

Using R, Chapter 6: Normal Distributions pnorm and …
cosmosweb.champlain.edu1 Using R, Chapter 6: Normal Distributions The pnorm and qnorm functions. Getting probabilities from a normal distribution with mean and standard deviation ˙

Using the TI-83/84 Plus Chapter 8: Hypothesis Testing ...
cosmosweb.champlain.eduChapter 8: Hypothesis Testing - One Sample Here we see how to use the TI 83/84 to conduct hypothesis tests about proportions and means. The software will calculate the test statistic and the P-value for the test statistic. It does not give you the critical value.
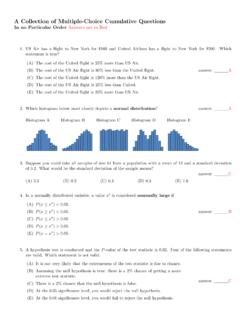
A Collection of Multiple-Choice Cumulative Questions In …
cosmosweb.champlain.eduA Collection of Past Questions Organized by Chapter Chapter 1: Sampling, Levels of Measurement, Percentages 1.A random sample is one with which characteristic? (A)Its members are chosen haphazardly. answer: (B)Every member of the population has an equal chance of being chosen for the sample.
Related documents

USING EXCEL SOLVER IN OPTIMIZATION PROBLEMS
archives.math.utk.eduSpreadsheet Modeling and Excel Solver A mathematical model implemented in a spreadsheet is called a spreadsheet model. Major spreadsheet packages come with a built-in optimization tool called Solver. Now we demonstrate how to use Excel spreadsheet modeling and Solver to find the optimal solution of optimization problems.
239 Excel Keyboard Shortcuts
d13ot9o61jdzpp.cloudfront.netBelow is a huge list of Excel keyboard shortcuts you can use to work faster. Scroll through the list or use the Index to quickly go to the section you want. How To Read The List Where shortcut keys must be pressed together they will be shown like this Ctrl + P which means press CTRL and P together.
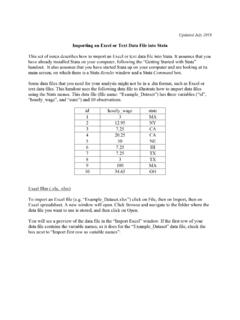
Importing an Excel or Text Data File into Stata 2018
sociology.fas.harvard.eduExcel files (.xls, .xlsx) To import an Excel file (e.g. “Example_Dataset.xlsx”) click on File, then on Import, then on Excel spreadsheet. A new window will open. Click Browse and navigate to the folder where the data file you want to use is stored, and then click on Open. You will see a preview of the data file in the “Import Excel” window.

How to Use Excel to Analyze Survey Data - Pima County
webcms.pima.govJan 18, 2011 · •Today: How to Use Excel to Analyze Survey Data. Today •Introductions •Some brief Excel basics •Creating an Excel spreadsheet and doing data entry •Inspecting and cleaning your data •Organizing your data for analysis •Analyzing your data –basic descriptive statistics.
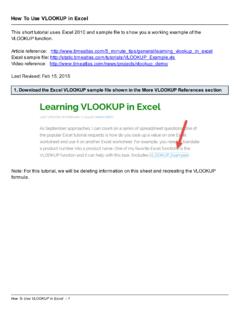
How To Use VLOOKUP in Excel - Productivity Portfolio
www.timeatlas.comFeb 15, 2015 · How To Use VLOOKUP in Excel - 2 2. Open the sample file you downloaded from above in Excel. The workbook will have 2 sheets at the bottom: V oters and P arty Codes. T he first sheet is a listing of registered voters and the second contains names of political parties. 3. Delete the cell entries for D2:D7 because we will be rebuilding the formula.
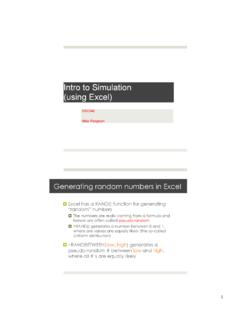
Intro to Simulation (using Excel) - University of Oregon
pages.uoregon.eduThe Excel features we have discussed can be blended together to create a simulation ! The flexibility of Excel allows us to create many types of simulation models !Why use a model? Value from simulation modeling 1. In business (and life), “do overs” are not always possible ! Simulations let you experiment with different decisions

SAS® ODS Destination for Microsoft Excel: Use the STYLE ...
www.sas.comThe ODS destination for Excel can take advantage of these styles maintained by SAS to apply formatting and color schemes to your Excel ou tput workbooks. I show you how to use the STYLE option in the ODS destination for Excel to enhance your output workbooks.

Using SAS ODS Create Excel Worksheets - SAS Support
support.sas.comMicrosoft Excel worksheets enable you to explore data that answers the difficult questions that you face daily in your work. When you combine the SAS® Output Deliver System (ODS) with the capabilities of Excel, you have a powerful toolset you can use to manipulate data in various ways, including highlighting

Excel Lab 1: Euler’s Method - University of Richmond
www.mathcs.richmond.edu(Note the use of the $ in the cell address for the timestep. Refer to Excel Lab 1 if you have forgotten what this means.) This results in the value 0.1 appearing in cell B6. Now, highlight and drag cell B6 down the column, until you reach the desired ending value. For example, if we choose to stop Euler’s Method at x=1, our spreadsheet would look