
Using SPSS, Chapter 8: Hypothesis Testing - One Sample
Chapter 8.3 - Hypothesis Tests About a Mean: ˙Not Known 1.Open or create your data. It must be in the form of rows=cases and columns=variables. SPSS can not be used with only the summarizing statistics (mean, standard deviation, sample size). Below left is the sample data. The sample mean is 38.6 and the sample standard deviation is 8.5. 2.
Download Using SPSS, Chapter 8: Hypothesis Testing - One Sample

Information
Domain:
Source:
Link to this page:
Documents from same domain
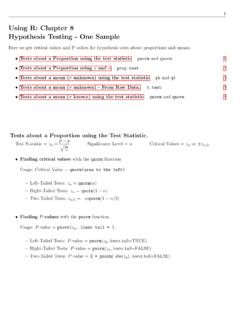
Using R: Chapter 8 Hypothesis Testing - One Sample
cosmosweb.champlain.eduUsing R: Chapter 8 Hypothesis Testing - One Sample Here we get critical values and P-values for hypothesis tests about proportions and means. Tests about a Proportion using the test statistic pnorm and qnorm. 1 Tests about a Proportion using xand n prop.test 2 Tests about a mean (˙unknown) using the test statistic pt and qt 3

Using Excel, Chapter 8: Hypothesis Testing - One Sample
cosmosweb.champlain.eduChapter 8.2 - Hypothesis Testing About a Proportion Notation { Test Statistic = z ^p = p^ p q pq n { Signi cance Level = (in decimal form) { Critical Values = z or z =2 Finding Critical Values Here we use the NORM.S.INV function. NORM.S.INV stands for the inverse of the standard normal distribution (z-distribution).

Using SPSS, Chapter 9: Hypothesis Testing - Two Samples
cosmosweb.champlain.eduChapter 9.2 - Hypothesis Tests for Two Means: Independent Data 4 SPSS does this really well but you do need the raw data1. Click here for online calculators that work well with summary statistics. Chapter 9.3 - Hypothesis Tests for Two Proportions 6 SPSS doesn’t do this the same way it is done in the book.

Using R: Frequency Distributions, Histograms, Scatterplots ...
cosmosweb.champlain.eduThen we created a relative and cumulative frequency table from this. Frequency Distribution: Males Scores Frequency 30 - 39 1 40 - 49 3 50 - 59 5 60 - 69 9 70 - 79 6 80 - 89 10 90 - 99 8 Relative Frequency Distribution: Males Relative Scores 30 - 39 2.4% 40 - 49 7.1% 50 - 59 11.9% 60 - 69 21.4% 70 - 79 14.3% 80 - 89 23.8% 90 - 99 19.0% ...

Using R, Chapter 6: Normal Distributions pnorm and …
cosmosweb.champlain.edu1 Using R, Chapter 6: Normal Distributions The pnorm and qnorm functions. Getting probabilities from a normal distribution with mean and standard deviation ˙

Using the TI-83/84 Plus Chapter 8: Hypothesis Testing ...
cosmosweb.champlain.eduChapter 8: Hypothesis Testing - One Sample Here we see how to use the TI 83/84 to conduct hypothesis tests about proportions and means. The software will calculate the test statistic and the P-value for the test statistic. It does not give you the critical value.
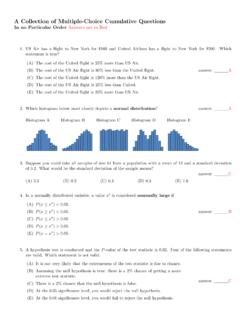
A Collection of Multiple-Choice Cumulative Questions In …
cosmosweb.champlain.eduA Collection of Past Questions Organized by Chapter Chapter 1: Sampling, Levels of Measurement, Percentages 1.A random sample is one with which characteristic? (A)Its members are chosen haphazardly. answer: (B)Every member of the population has an equal chance of being chosen for the sample.
Related documents

CUDA by Example Sample - Nvidia
developer.download.nvidia.comCUDA by Example An IntroductIon to GenerAl-PurPose GPu ProGrAmmInG JAson sAnders edwArd KAndrot Upper Saddle River, NJ • Boston • Indianapolis • San Francisco

CHAPTER 20 Sample Math Questions: Multiple-Choice
collegereadiness.collegeboard.orgChAPTeR 20 | Sample Math Questions: Multiple-Choice 261 Choice C is incorrect. This value may result from a combination of errors. You may have erroneously determined the slope of the new line by subtracting 5 from the numerator and subtracting 7 from the . denominator in the slope of line. ℓ. Choice D is incorrect and may result from adding 5 _

CHAPTER 9 Sample Reading Test Questions - College Board
collegereadiness.collegeboard.orgCHAPTeR 9 | Sample Reading Test Questions. 75. Explanation: Choice B is the . best answer because the context makes clear that the clustering of jobs, innovation, and productivity will be more concentrated in, or more densely packed into, “a smaller number of bigger cities and city-regions” (lines 53-54).
Using R: Chapter 8 Hypothesis Testing - One Sample
cosmosweb.champlain.eduUsing R: Chapter 8 Hypothesis Testing - One Sample Here we get critical values and P-values for hypothesis tests about proportions and means. Tests about a Proportion using the test statistic pnorm and qnorm. 1 Tests about a Proportion using xand n prop.test 2 Tests about a mean (˙unknown) using the test statistic pt and qt 3

New Employee Orientation Sample
d22bbllmj4tvv8.cloudfront.netThe ATD Workshop Series. Whether you are a professional trainer who needs to pull together a new training program next week, or someone who does a bit of training as a part of your job, you’ll find the ATD Workshop

LEADERSHIP
d22bbllmj4tvv8.cloudfront.netThe ATD Workshop Series Whether you are a professional trainer who needs to pull together a new training program next week, or someone who does a bit of training as a part of your job, you’ll find the ATD Workshop

aboikis/Shutterstock Restaurant Operations
www.pearsonhighered.comCHAPTER 7 Restaurant Operations 12. Check daily reports for indications of internal theft. 13. Instruct employees regarding the control of waste, portion sizes, and so on. 14. Prepare forecast for daily or shift food preparation. Service 1. Receive and record table reservations. 2. Greet familiar customers by name. 3. Seat customers. 4.

chapter 1 THE DIAGNOSTIC PROCESS
www.pearsonhighered.com4 ChaPTEr 1 FIGURE 1–4 a form that the customer should fill out if there is a driveability concern to help the service technician more quickly find the root cause. M01_HALM3495_07_SE_C01.indd 4 22/12/18 5:24 PM