
Using SPSS, Chapter 8: Hypothesis Testing - One Sample
Chapter 8.3 - Hypothesis Tests About a Mean: ˙Not Known 1.Open or create your data. It must be in the form of rows=cases and columns=variables. SPSS can not be used with only the summarizing statistics (mean, standard deviation, sample size). Below left is the sample data. The sample mean is 38.6 and the sample standard deviation is 8.5. 2.
Download Using SPSS, Chapter 8: Hypothesis Testing - One Sample

Information
Domain:
Source:
Link to this page:
Documents from same domain
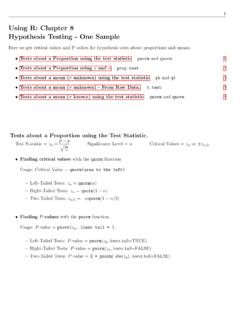
Using R: Chapter 8 Hypothesis Testing - One Sample
cosmosweb.champlain.eduUsing R: Chapter 8 Hypothesis Testing - One Sample Here we get critical values and P-values for hypothesis tests about proportions and means. Tests about a Proportion using the test statistic pnorm and qnorm. 1 Tests about a Proportion using xand n prop.test 2 Tests about a mean (˙unknown) using the test statistic pt and qt 3

Using Excel, Chapter 8: Hypothesis Testing - One Sample
cosmosweb.champlain.eduChapter 8.2 - Hypothesis Testing About a Proportion Notation { Test Statistic = z ^p = p^ p q pq n { Signi cance Level = (in decimal form) { Critical Values = z or z =2 Finding Critical Values Here we use the NORM.S.INV function. NORM.S.INV stands for the inverse of the standard normal distribution (z-distribution).

Using SPSS, Chapter 9: Hypothesis Testing - Two Samples
cosmosweb.champlain.eduChapter 9.2 - Hypothesis Tests for Two Means: Independent Data 4 SPSS does this really well but you do need the raw data1. Click here for online calculators that work well with summary statistics. Chapter 9.3 - Hypothesis Tests for Two Proportions 6 SPSS doesn’t do this the same way it is done in the book.

Using R: Frequency Distributions, Histograms, Scatterplots ...
cosmosweb.champlain.eduThen we created a relative and cumulative frequency table from this. Frequency Distribution: Males Scores Frequency 30 - 39 1 40 - 49 3 50 - 59 5 60 - 69 9 70 - 79 6 80 - 89 10 90 - 99 8 Relative Frequency Distribution: Males Relative Scores 30 - 39 2.4% 40 - 49 7.1% 50 - 59 11.9% 60 - 69 21.4% 70 - 79 14.3% 80 - 89 23.8% 90 - 99 19.0% ...

Using R, Chapter 6: Normal Distributions pnorm and …
cosmosweb.champlain.edu1 Using R, Chapter 6: Normal Distributions The pnorm and qnorm functions. Getting probabilities from a normal distribution with mean and standard deviation ˙

Using the TI-83/84 Plus Chapter 8: Hypothesis Testing ...
cosmosweb.champlain.eduChapter 8: Hypothesis Testing - One Sample Here we see how to use the TI 83/84 to conduct hypothesis tests about proportions and means. The software will calculate the test statistic and the P-value for the test statistic. It does not give you the critical value.
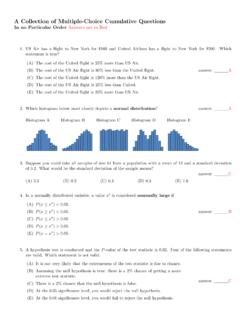
A Collection of Multiple-Choice Cumulative Questions In …
cosmosweb.champlain.eduA Collection of Past Questions Organized by Chapter Chapter 1: Sampling, Levels of Measurement, Percentages 1.A random sample is one with which characteristic? (A)Its members are chosen haphazardly. answer: (B)Every member of the population has an equal chance of being chosen for the sample.
Related documents

Qualitative Research Method Summary - JMEST
www.jmest.orgqualitative research data because it is perceived as "talking," and talking is natural [18] P.36” Individual interview for the qualitative method can be designed in three different ways, depending on the researcher. The first type is the In-depth interview, or can …

How to appraise qualitative research - Evidence-Based Nursing
ebn.bmj.comconcepts, thoughts, experiences or feelings.2 Qualitative research examines how or why a phenomenon occurs. It collects data in the form of words, texts and or images via interviews, observations, photographs or document reviews. Qualitative research does not use discrete vari--ically appraising qualitative research, steps need to be
Using Generic Inductive Approach in Qualitative ...
files.eric.ed.govGiven this, a qualitative research strategy appears to be more suitable for investigating this question. However, choosing a suitable qualitative research approach for this study involved a very difficult thinking process, as Rossman and Wilson state, “the qualitative study design was exploratory and complex itself” (1985, p. 19).
What Is Qualitative Research? - SAGE Publications Ltd
uk.sagepub.compeople see things. Many qualitative studies examine how people interact with one another in particular settings like the workplace, a museum or an auction house (see Heath et al., 2010, discussed in Chapter 10). v The standard, published quantitative study usually does begin with a hypothesis which it then seeks to test.

EXAMPLE OF QUALITATIVE RESEARCH DESIGN
www.govst.eduAll data analyses will conducted using Dedoose (an online/secure software program for qualitative analysis). 2. Hypothesis: No hypothesis for qualitative research (Instead clearly and concisely articulate your overarching question and one or two sub questions – see example below) Overarching research question:
DEVELOPING HYPOTHESIS AND RESEARCH QUESTIONS
www.public.asu.eduQualitative Research ... “A hypothesis is a conjectural statement of the relation between two or more variables”. (Kerlinger, 1956) “Hypothesis is a formal statement that presents the expected relationship between an independent and dependent variable.”(Creswell, 1994)