
Using SPSS, Chapter 9: Hypothesis Testing - Two Samples
Hypothesis Testing - Two Samples Chapter 9.1 - Hypothesis Tests for Mean Di erences: Paired Data 2 SPSS does this really well but you do need the raw data. Click here for online calculators that work well with summary statistics. Chapter 9.2 - Hypothesis Tests for Two Means: Independent Data 4 SPSS does this really well but you do need the raw ...
Download Using SPSS, Chapter 9: Hypothesis Testing - Two Samples

Information
Domain:
Source:
Link to this page:
Documents from same domain
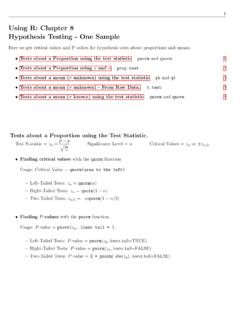
Using R: Chapter 8 Hypothesis Testing - One Sample
cosmosweb.champlain.eduUsing R: Chapter 8 Hypothesis Testing - One Sample Here we get critical values and P-values for hypothesis tests about proportions and means. Tests about a Proportion using the test statistic pnorm and qnorm. 1 Tests about a Proportion using xand n prop.test 2 Tests about a mean (˙unknown) using the test statistic pt and qt 3

Using SPSS, Chapter 8: Hypothesis Testing - One Sample
cosmosweb.champlain.eduChapter 8.3 - Hypothesis Tests About a Mean: ˙Not Known 1.Open or create your data. It must be in the form of rows=cases and columns=variables. SPSS can not be used with only the summarizing statistics (mean, standard deviation, sample size). Below left is the sample data. The sample mean is 38.6 and the sample standard deviation is 8.5. 2.

Using Excel, Chapter 8: Hypothesis Testing - One Sample
cosmosweb.champlain.eduChapter 8.2 - Hypothesis Testing About a Proportion Notation { Test Statistic = z ^p = p^ p q pq n { Signi cance Level = (in decimal form) { Critical Values = z or z =2 Finding Critical Values Here we use the NORM.S.INV function. NORM.S.INV stands for the inverse of the standard normal distribution (z-distribution).

Using R: Frequency Distributions, Histograms, Scatterplots ...
cosmosweb.champlain.eduThen we created a relative and cumulative frequency table from this. Frequency Distribution: Males Scores Frequency 30 - 39 1 40 - 49 3 50 - 59 5 60 - 69 9 70 - 79 6 80 - 89 10 90 - 99 8 Relative Frequency Distribution: Males Relative Scores 30 - 39 2.4% 40 - 49 7.1% 50 - 59 11.9% 60 - 69 21.4% 70 - 79 14.3% 80 - 89 23.8% 90 - 99 19.0% ...

Using R, Chapter 6: Normal Distributions pnorm and …
cosmosweb.champlain.edu1 Using R, Chapter 6: Normal Distributions The pnorm and qnorm functions. Getting probabilities from a normal distribution with mean and standard deviation ˙

Using the TI-83/84 Plus Chapter 8: Hypothesis Testing ...
cosmosweb.champlain.eduChapter 8: Hypothesis Testing - One Sample Here we see how to use the TI 83/84 to conduct hypothesis tests about proportions and means. The software will calculate the test statistic and the P-value for the test statistic. It does not give you the critical value.
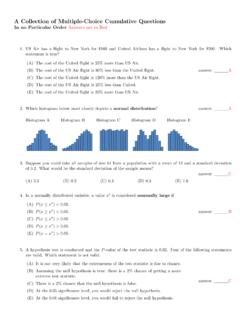
A Collection of Multiple-Choice Cumulative Questions In …
cosmosweb.champlain.eduA Collection of Past Questions Organized by Chapter Chapter 1: Sampling, Levels of Measurement, Percentages 1.A random sample is one with which characteristic? (A)Its members are chosen haphazardly. answer: (B)Every member of the population has an equal chance of being chosen for the sample.
Related documents

STATISTICAL METHODS
sccn.ucsd.edustandard statistical models and methods of statistical inference. (1) Standard models (binomial, Poisson, normal) are described. Application of these models to confidence interval estimation and parametric hypothesis testing are also described, including two-sample situations when the purpose is to compare two (or more) populations with
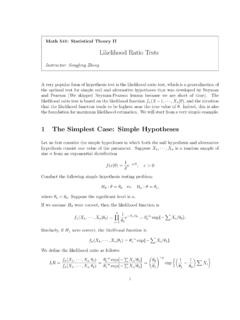
Likelihood Ratio Tests
people.missouristate.eduMath 541: Statistical Theory II Likelihood Ratio Tests Instructor: Songfeng Zheng A very popular form of hypothesis test is the likelihood ratio test, which is a generalization of the optimal test for simple null and alternative hypotheses that was developed by Neyman and Pearson (We skipped Neyman-Pearson lemma because we are short of time). The
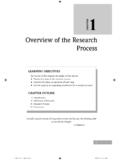
Overview of the Research Process - Jones & Bartlett Learning
samples.jbpub.comTesting the hypothesis through data analysis. This step involves analyzing the data to draw conclusions to support/refute the hypothesis or answer the research question. 4. Conclusions. Results of the analysis are interpreted vis-à-vis the hypothesis or research question. 5. Compare the results to previous established theory. The findings from the

Module 5b: Pre- and Post-testing for Student Learning
assessment.aa.ufl.edustatistical test of the difference between a set of paired samples, such as pre-and post-test scores. This is sometimes called the dependent samples t -test. For every observed change in one student’s pre-test score, there is an expected change in that student’s post-test score. For this test, the null hypothesis is that there are no ...
Introduction to Statistical Analysis
ienrol.flinders.edu.au• Introduction to hypothesis testing, including interpreting p-values • Concepts of effect size and power • How to select which statistical method is appropriate for typical research questions. Pawel Skuza 2013 What is ‘Statistics’ ? sta·tis·tics(st-t s t ks) n. 1.

Statistical Hypothesis Testing - afit.edu
www.afit.eduStatistical hypothesis testing is a vehicle for answering these questions. Care must be taken in setting up the hypothesis test to ensure that the analysis performed addresses the test objective. Too often DoD testing includes “implied” hypothesis tests in which the actual

Statistical Testing for Dummies!!!
www.cbgs.k12.va.usStatistical Testing for Dummies!!! ... The statistical test that you select will depend upon your experimental design, especially the sorts of Groups (Control and/or Experimental), Variables (Independent ... Keep in mind that a statistical test is always a test on your Null Hypothesis . More specifically, it tests the Probability that your Null ...
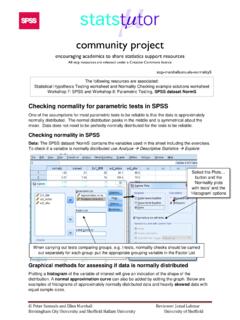
Checking normality in SPSS
www.sheffield.ac.ukStatistical Hypothesis Testing worksheet and Normality Checking example solutions worksheet . Workshop 7: SPSS and Workshop 8: Parametric Testing, SPSS dataset NormS When carrying out tests comparing groups, e.g. t-tests, normality checks should be carried out separately for each group: put the appropriate grouping variable in the Factor List