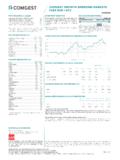
Transcription of Investec GS Global Strategic Equity - The Financial …
1 International fund factsheet Investec GS Global Strategic Equity August 2018. This factsheet is for information only and should not be considered a Financial promotion. The information shown should not be relied upon for buying and selling decisions. Fund objective The Fund aims to grow the value of your investment over the long term. The Fund invests around the world primarily in the shares of companies which are believed to offer above average opportunities for capital gains. For example, companies that are believed to be of high quality (such as Global brands) or offer good value (meaning they are undervalued within the market), those expected to benefit from increases in profit expectations or are currently or expected to receive increased investor demand.
2 The Fund may use derivatives ( Financial contracts whose value is linked to the price of an underlying asset) for efficient portfolio management purposes with the aim of either managing the Fund risks or reducing the costs of managing the Fund. Mirror fund key facts Underlying fund key facts . Code J74 ISIN code LU0345770308. ISIN code GB0005679476 Launch date April 1994. Currency USD Fund manager Investec Asset Management Luxembourg Launch date August 1997. Ongoing charges figure - as at Fund key 31/12/2017. Dealing Daily Authorised in Hong Kong Yes Approved in Singapore No FE sector Equity - International Risk rating Grade 5.
3 Top holdings - as at 30/06/2018. The top holdings listed below have been determined by the percentage their value represents within the fund. We display a maximum of 10 holdings, which may or may not represent the full holdings of the fund. INC PAYPAL HOLDINGS INC CITIGROUP INC TELEPERFORMANCE ALPHABET INC REPSOL SA ASAHI GROUP HOLDINGS LTD UNILEVER PLC UNITEDHEALTH GROUP INC BOOKING HOLDINGS INC Source: FE. further information about terms used in these sections can be found on page 3 and 4. Page 1. International fund factsheet | Investec GS Global Strategic Equity | August 2018.
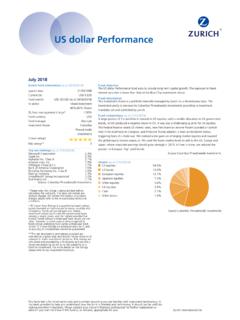
4 Underlying fund breakdown The fund breakdown shown below is provided by FE and derived from information reported by the fund manager. It may include asset, sector or geographic allocations, as well as the credit ratings of any fixed interest elements of the fund (where available). Sector allocation -as at 30/06/2018 Asset allocation - as at 30/06/2018. Information Technology North America Equities Financials Emerging Markets Equities Consumer Discretionary Europe ex UK Equities Health Care Japan Equities Industrials United Kingdom Equities Materials Far East ex Japan Equities Consumer Staples Middle East Equities Energy Cash Real Estate Source: FE.
5 Cash Mirror fund performance 30/6/2017 - 30/6/2016 - 30/6/2015 - 30/6/2014 - 30/6/2013 - Performance over rolling one year periods 30/6/2018 30/6/2017 30/6/2016 30/6/2015 30/6/2014. Investec GS Global Strategic Equity Since Cumulative performance 1 year 3 years 5 years 10 years launch Investec GS Global Strategic Equity Source: FE. Figures on a bid-to-bid basis to 31/7/2018. The information shown refers to the past. Past performance is not a reliable guide to future performance. Fund prices may go up as well as down and you may get back less than you paid in.
6 Performance figures are net of all charges. Please note that the securities held within a fund may not be denominated in the currency of that fund and, as a result, fund prices may rise and fall purely on account of exchange rate fluctuations. Percentage growth over five years (as at 31/07/18). 60%. 50%. 40%. 30%. 20%. 10%. 0%. -10%. Jul 13 Apr 14 Oct 14 Apr 15 Oct 15 Apr 16 Oct 16 Apr 17 Oct 17 Apr 18 Jul 18. Investec GS Global Strategic Equity Equity - International Source: FE. Figures on a bid-to-bid basis Page 2.
7 International fund factsheet | Investec GS Global Strategic Equity | August 2018. Further information Important information regarding mirror funds Fund key facts For each fund managed by external investment managers Sector classification Our funds and (where applicable). Friends Provident International has set up its own mirror fund, the underlying funds they invest in, are classified into sectors, which invests exclusively in the underlying fund, apart from a ensuring that funds operating similar investment strategies proportionately small amount, which may be held as a cash are grouped together and can be compared on a like for like balance.
8 This means that the price of the Friends Provident basis. The sectors referred to in this document are taken from International fund will be different from the corresponding the FE Offshore Insurance Universe. fund due to the cash holding and any differences in fund charges, but will move mainly in line with it. These mirror funds ISIN code the International Securities Identification can only be accessed using Friends Provident International Number (ISIN) is a 12-character alpha-numerical code used as product wrappers.
9 Please note that there are fees charged to a unique identifier worldwide. investments in the mirror funds that will affect their return. For Ongoing Charges Figure (OCF) The Ongoing Charges further details, please refer to the relevant product Figure is a measure of the total annual charges taken from the information brochure. underlying fund and includes the Annual Management Charge Risk grades and descriptions plus the Additional Expenses. Grade 1. Funds offering conservative return similar to money market rates.
10 Grade 2. Low risk funds offering security and potential growth. Grade 3. These funds take a balanced approach to investment by This factsheet is intended for general information purposes holding a diverse portfolio of assets. only and does not constitute Financial advice. Please speak to your Financial adviser for more details. Whilst every care has Grade 4. been taken to ensure the accuracy of this factsheet , Friends A more focused asset exposure provides good growth Provident International Limited cannot accept any liability to potential with the risk of short-term volatility.