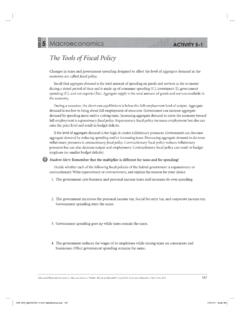
Transcription of UNIT 1 Macroeconomics LESSON 1 - Denton ISD
1 advanced placement Economics Teacher Resource Manual National Council on economic Education,New York, and DescriptionThis LESSON uses the concept ofopportunity cost todevelop a production possibilities pro-duction possibilities curve represents the choicesthat society cost is a fundamen-tal concept in economics and includes not onlyout-of-pocket costs but also the cost to society ofnot using the resources to produce an alternativeproduct or forms oftheproduction possibilities curves illustrate 1 reinforces the concept ofopportunity cost and investigates the alternativeshapes ofthe production possibilities use production possibilities curves to illus-trate the economic situation that nations face andthe advantages that exist ifpeople or nations spe-cialize in the production ofspecific goods
2 Andservices and then trade for the goods and servicesthey concept ofcomparative advantageunderlies trade and exchange within an economyand between different 2 pro-vides practice at determining absolute and compar-ative scarcityand opportunity scarcity and opportunity cost to a num-ber ofeveryday production possibilities curves usinghypothetical the concept ofopportunity cost to a pro-duction possibilities the different locations ofpoints on,outside and inside a production and explain different shaped pro-duction possibilities absoluteadvantageand comparative advantage when how both parties gain from specializa-tion and RequiredTwo class periods or 90 1 and , , and a lecture on scarcityand opportunity cost.
3 (A)People have unlimited wants.(B)Resources to fulfill these wants are are land,labor,capital and entre-preneurship.(C)Here are some examples ofscarcity youmight want to use:(i)A teenager wants to go to a soccer gameon Saturday night but also wants to catchup on late school encounters the scarcity oftime.(ii)A family wants to take a vacation toMexico and build an addition on experience scarcity becausefamily income will not permit both and society must choose between thecompeting must make costemphasizes that people aremaking choose to do one activityand the cost is giving up another Visual ofa production possibilities curve(PPC) and emphasize the following points.(A)The PPC is drawn assuming that1 MacroeconomicsLESSON 1 UNITS carcity,Opportunity Cost,Production Possibilities andComparative Advantage336 advanced placement Economics Teacher Resource Manual National Council on economic Education,New York, (i)all resources (land,labor,capital,entre-preneurship) are fully employed.
4 (ii)the technology is constant.(B)The shape ofthe PPC (bowed out or con-cave to the origin) determines the trade-offin the production ofthe two that the trade-offis not constant butincreasing as we move along the curve.(C)What other shapes could the PPC take,andwhat do the shapes imply about the trade-off? The PPC can be either a straight line,representing constant opportunity costs,orconvex to the origin,representing provides alternative shapes.(D)Ifthe factors ofproduction were not fullyutilized,where on the graph would an econ-omy be? The economy would be interior tothe PPC,that is,between the origin and the students complete Activity 1 as reviewing Activity 1,emphasize thesepoints:(A)Ifthe cost ofobtaining one more unit ofagood is increasing as you move down thePPC,then the cost ofobtaining more oftheother good must also be increasing as youmove up the curve.
5 (B)The assumptions that determine the loca-tion ofthe PPC curve(C)What determines ifan economy is on thePPC curve,inside (in the region betweenthe curve and the origin) or outside(beyond) the with a discussion thestudents what life would be like ifthey could consume only the goods produced by the statethey live would production in the statechange ifeach state had to be self-sufficient?Emphasize the point that it is individuals,notnations or states,that Visual to distinguish between absoluteadvantageand comparative examples on Visual (A)What ifan economics professor can doword processing faster than any secretarythe professor could hire? The professor hasan absolute advantage in teachingeconomics and in word do her own typing?
6 Opportu-nity cost ofthe professor s time spent as asecretary is very high,perhaps $75 an should hire a secretary to do the typingbecause a secretary s wage is significantlyless than $75 an hour.(B)The auto-mechanic and doctor situation isthe same as the professor/secretary Visual to illustrate absolute and com-parative advantage using theopportunity cost ofcorn and ofsunscreen forthe will help the students doActivity that comparativeadvantage is based on the lower has the absolute advantage andcomparative advantage in the production has an absolute advantage in theproduction has a compar-ative advantage in producing the students complete Activity 2 the answers to Activity 1 UNITA dvanced placement Economics Teacher Resource Manual National Council on economic Education,New York.
7 Opportunity Cost and Production Possibilities CurvesScarcity necessitates or producing more ofone commodity or service means con-suming or producing less ofsomething opportunity cost ofusing scarce resources for onecommodity or service instead ofsomething else is often represented in graphical form as a productionpossibilities AUse Figures and to answer Questions 1 and in the answer blanks,or underline thecorrect answer in economy represented by Figure is presently producing 12 units ofGood B and zero unitsofGood A:(A)The opportunity cost ofincreasing production ofGood A from zero units to one unit is theloss of two unit (s) ofGood B.(B)The opportunity cost ofincreasing production ofGood A from one unit to two units is theloss of two unit (s) ofGood B.
8 (C)The opportunity cost ofincreasing production ofGood A from two units to three units is theloss of two unit (s) ofGood B.(D)This is an example of(constant/ increasing / decreasing / zero) opportunity cost per unit forGood 1nACTIVITY 1 AnswerKey UNIT10122103 GOOD AGOOD B4566824 Figure Possibilities Curve 1338 advanced placement Economics Teacher Resource Manual National Council on economic Education,New York, 1nACTIVITY 1 AnswerKey economy represented in Figure is presently producing 12 units ofGood B and zero unitsofGood A:(A)The opportunity cost ofincreasing production ofGood A from zero units to one unit is theloss of two unit (s) ofGood B.(B)The opportunity cost ofincreasing production ofGood A from one unit to two units is theloss of four unit (s) ofGood B.
9 (C)The opportunity cost ofincreasing production ofGood A from two units to three units is theloss of six unit (s) ofGood B.(D)This is an example of(constant / increasing/ decreasing / zero) opportunity cost per unit forGood AGOOD B236824 Figure Possibilities Curve 2 advanced placement Economics Teacher Resource Manual National Council on economic Education,New York, B Use the axes in Figures and to draw the type ofcurve that illustrates the label above each 1nACTIVITY 1 AnswerKey UNITGOOD AIncreasing opportunity cost per unit of Good BGOOD BFigure Possibilities Curve 3 GOOD AConstant opportunity cost per unit of Good BGOOD BFigure Possibilities Curve 4340 advanced placement Economics Teacher Resource Manual National Council on economic Education,New York.
10 1nACTIVITY 1 AnswerKey UNITPart CUse Figure to answer the next five question starts with Curve BB' as a country sproduction possibilities there is a major technological breakthrough in the consumer-goods industry,and thenew technology is widely curve in the diagram would represent the new produc-tion possibilities curve? (Indicate the curve you choose with two letters.) BD' a new government comes into power and imposes a significant tax on the use ofautomated machinery and modern production techniques in all curve in thediagram would represent the new production possibilities curve? (Indicate the curve you choosewith two letters.) AA' massive new sources ofoil and coal are found within the economy,and there are majortechnological innovations in both curve in the diagram would represent thenew production possibilities curve?