Transcription of Using Amos for structural equation modeling in market …
1 Using amos for structural equationmodeling in market researchby Lynd D. Bacon, ,Lynd Bacon & Associates, SPSS paper white paper Using amos for structural equation modeling in market research 2 structural equation models (SEMs) describe relationships between are similar to combining multiple regression and factor analysis. SEMsalso offer some important, additional benefits over these techniques includingan effective way to deal with multicollinearity, and methods for taking into account theunreliability of consumer response paper introduces you to SEMs as well as amos , a software tool distributed by SPSSInc. amos stands for Analysis of Moment Structures. amos has a unique graphical interface, and was specifically designed to make fitting SEMs paper will:nReview some SEM basics and compare SEMs to multiple regression and factor analysis modelsnCover sample size requirements and two important SEM issues: model identification and model equivalencenExplain why Using SEMs for multicollinearity and measurement reliability provides important advantagesnGive two examples Using amos for structural equation modelsThe first of the two examples compares the importance of satisfaction drivers acrosscustomer segments.
2 The insight we get from amos tells us the importance of the driversprobably shouldn t be compared directly, because the data aren't really measuring thesame variables in the second example is a twist on some recently reported modeling of brand halos. The goal was to find out how much halos may contribute to customers perceptions ofproducts from two manufacturers. The observations show the brands have halos of different strengths, and their effects are different for different product , regression models and factor analysisSEMs can include two kinds of variables: observed and latent. Observed variables havedata, like the numeric responses to a rating scale item on a questionnaire such as gen-der or height. Observed variables in SEMs are also usually continuous. Latent variablesare not directly observed, but you still want to know about them. To observe latent vari-ables, you must build models express latent variables in terms of observed latent variables in SEMs are continuous variables and can, in theory, have an infinitenumber of values.
3 Examples of latent variables in marketing include brand attitudes, customer satisfaction, perceived value, repurchase intentions and perceived income might best be considered a latent variable in many various forms of SEMs have been developed, the vast majority express linear relationships between variables. This is also how variables are usually related in regression and factor analysis models variables are expressed as weighted linearcombinations of other paper Using amos for structural equation modeling in market research 3 Variables that depend on other variables are called dependent. Variables that do notdepend on other variables in a model are called independent. When Using SEMs,these variables are also called endogenous and exogenous, the linear relationship expressed by equation 1. This equation says that per-ceived value for case i is the sum of the quality for i multiplied by the coefficient a, cost for i multiplied by the coefficient b, plus an error.
4 The error term representsthat part of perceived value for case i that is not captured by its linear dependence onquality and cost. When combined with some assumptions, the equation describes amodel of value that may depend on quality and 1 When we fit a model like the model in equation 1 to a data set, we re trying to pick estimates for coefficients a and b that minimize some function of the errors across observations, given some assumptions about these errors. Note, our model assumes that allcases in the data set have the same values for a and b. They are fixed in the 1 may look like a regression equation , without an intercept term on the right-hand side. The coefficients a and b represent the regression coefficients. Value, quality and cost are observed variables. Error is the difference between the observed and predicted values for each of the , you may see the equation as describing a factor model in which the observed variable called value loads on two factors called quality and cost.
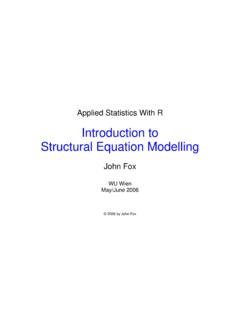
5 The error might becalled uniqueness, instead. From this perspective, quality and cost are latent to SEM path diagramsFigure 1 shows another way of describing the model in equation 1. Figure 1 is called apath diagram. Path diagrams are a clear way of summarizing SEMs. You can draw pathdiagrams quite easily Using the graphics tools in amos . amos also generates the neces-sary equation statements to fit the models you variables are drawn as boxes, latent variables are drawn as circles or ellipses. Note, the error term in the path diagram is drawn as latent errors are estimated, not measured directly. When onevariable is believed to cause another vari-able, the relationship between the variablesis shown as a directed or one-headed arrow,from cause to effect. Whether one variable causes another is an assumption that youmake, not something the data can tell 1.
6 A path diagram for the Value ModelabQualityCostValueerrorvaluei= a *qualityi+ b *costi+ erroriwhite paper Using amos for structural equation modeling in market research 4 Sometimes covariation between two variables needs to be included in a SEM. This kind of undirected relationship is shown as a curved, two-headed arrow connecting the each arrow, there may be an estimated loading or weight, like the coefficients a and b in Figure 1. Weights constrained to a particular value are often labeled withthat value. Although it s not shown in Figure 1, a coefficient of would be specifiedfor the effect of error on value. This constraint means the error has the same units ofmeasurement scale as the brand rating. In a regression model, the residuals have thesame scale of measurement as the dependent may also include one or more linear regression equations that describe how some variables depend on others.
7 These are called structural equations . The collectionof them is sometimes called the structural equations model, or the structural model inan SEM. The coefficients describing how dependent variables depend on independentvariables are sometimes called path can use latent variables in structural equations as dependent or independent variables. When you use a latent variable in a SEM, it is usually modeled Using two ormore observed variables called indicator example, you want to model brand loyalty as a latent variable. You ask customers to make quantitative judgments about their use of a brand, their intentions to continueusing the brand, and their willingness to recommend the brand to others. You could thenuse the responses on these indicator variables to model loyalty as a single latent each indicator variable related to loyalty would be expressed as a factor you might imagine, once you ve put together some structural equations and somemeasurement models, you can get a much more complicated model than what s shownin Figure 1.
8 Remember, these models are built Using simple parts, even though they can get complex. You ll find path diagrams are an effective way of summarizing evenvery extensive confirmatory modelsThere is an important difference between the factor analysis models that most market -ing research analysts use and the kind estimated for a SEM. Most applications of factoranalysis are exploratory, meaning that the goal is to reveal the relationships underly-ing a set of variables. Sometimes, the objective is to reduce a set of variables to asmaller, more manageable, number. You can use either exploratory factor analysis(EFA), or principal components analysis (PCA) for the case of either EFA or PCA, the loadings of any observed variable on any factorcan assume any value. That is, which variables load on which factors is not fixed, or constrained, in any way. What is constrained is the number of factors, and often the correlations between the factors are constrained to zero.
9 But the observed variables are allowed to load on any and all paper Using amos for structural equation modeling in market research 5 When Using SEMs, you take an approach like confirmatory factor analysis (CFA). Youspecify which loadings and path coefficients are free to vary, and which are to be fixedat particular values. You also specify whether variables are independent of each other,or whether they co-vary. See Bollen (1989) for a more detailed discussion of the variousdifferences between exploratory and confirmatory factor fitThe procedure for estimating and assessing the fit of SEMs is similar to what you dowith other statistical models. First, examine your data and check to see if the necessarydistributional assumptions are reasonable, and do what you can about them. The mostcommon estimation method for SEMs is maximum likelihood (ML) estimation.
10 A key assumption for this method is multivariate normality for the exogenous , describe one or more models to amos , indicating the estimation method alongwith other options. amos attempts to fit your model to the data. amos s goal is to pro-vide the best estimates of the freely varying parameters based on minimizing a functionthat indexes how well the model fits, and subject to the constraints you have gives you goodness-of-fit measures to help you evaluate your model s inspecting the results, you can adjust particular models and try to improve the can also compare competing models to find out which is better. In general, it s wiseto consider more than one model for any given data set. amos provides extensive modelfit diagnostics, including a large number of the fit indices used in the SEM the amos reference manual Arbuckle (1997), Bollen (1989) and Tanaka (1993) for descriptions of these fit SEM models is the basic method for testing all but the simplest of between nested models are usually evaluated Using the difference betweentheir chi square (x2) statistics relative to the difference in their degrees of model is nested within another when it is a simplification of the other due to oneor more additional is an example of nested models.