Example: barber
1 Multiple Regression Nonlinear Regression Regression
The correlation is 0.9344, but it is heavily influenced by a few outliers (the Indian and African elephants). The standard deviation of the residuals is 334.721. This is the typical distance of a point to the line (in the vertical direction). A 95% confidence interval on the brainweight of a mammal that weighed 100 kg would be
Tags:
Information
Domain:
Source:
Link to this page:
Documents from same domain
Lecture 20 - Logistic Regression - Duke University
www2.stat.duke.eduIt seems clear that both age and gender have an e ect on someone’s survival, how do we come up with a model that will let us explore this relationship? Even if we set Died to 0 and Survived to 1, this isn’t something we can transform our way out of - we need something more. One way to think about the problem - we can treat Survived and Died as

TIME SERIES MODELLING, INFERENCE AND …
www2.stat.duke.eduTIME SERIES MODELLING, INFERENCE AND FORECASTING ... A time series process is a stochastic process or a collection of random variables yt indexed in time. Note that yt will be used throughoutthe book to denote a random variable or an actual realisation of the time series process at time t. We use the

www2.stat.duke.edu
www2.stat.duke.eduRyan Tibshirani Data Mining: 36-462/36-662 January 22 2013 Optional reading: ESL 1410 . Information retrieval with the web information retrieval learned how to compute similarity Last time: scores (distances) of documents to a given query string But what if documents are webpages,

Chapter 3 - continued Chapter 3 sections
www2.stat.duke.eduChapter 3 - continued Chapter 3 sections ... We have the law of total probability for random variables (Theorem 3.6.3 in the book) We also have Bayes’ theorem for random variables (Theorem ... Chapter 3 - continued 3.7 Multivariate Distributions Multivariate Distributions - extension of bivariate ...

Hypothesis Testing - Duke University
www2.stat.duke.eduNull hypothesis: No difference in average fat lost in population for two methods. Population mean difference is zero. Alternative hypothesis: There is a difference in average fat lost in population for two methods. Population mean difference is not …

General Bivariate Normal - Duke University
www2.stat.duke.edu6.5 Conditional Distributions Multivariate Normal Distribution Matrix notation allows us to easily express the density of the multivariate normal distribution for an arbitrary number of dimensions. We express the k-dimensional multivariate normal distribution as follows, X ˘N k( ; There is a similar method for the multivariate normal ...

Multivariable Calculus - Duke University
www2.stat.duke.eduplanes and trajectories. Chapter 5 uses the results of the three chapters preceding it to prove the Inverse Function Theorem, then the Implicit Function Theorem as a corollary, and finally the Lagrange Multiplier Criterion as a consequence of the Implicit Function Theorem. Lagrange multipliers help with a type of multivariable
Convergence in Distribution Central Limit Theorem
www2.stat.duke.eduCentral Limit Theorem Theorem. [Central Limit Theorem (CLT)] Let X1;X2;X3;::: be a sequence of independent RVs having mean „ and variance ¾2 and a common distribution function F(x) and moment generating function M(t) deflned in a neighbourhood of zero. Let Sn = Xn i=1 Xn Then lim n!1 P • Sn ¡n„ ¾ p n • x ‚ = '(x) That is Sn ¡n ...
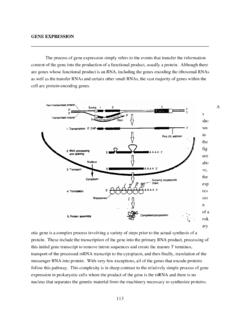
GENE EXPRESSION - Duke University
www2.stat.duke.educlasses of genes most clearly is the complexity of regulatory elements and factors necessary for the transcription of the mRNA genes. As stated before, transcription factors possess two essential properties - the ability to ... functional domains of a yeast transcription factor have been separated in two vectors. Sequences

Tree Based Methods: Regression Trees
www2.stat.duke.eduBasicsofDecision(Predictions)Trees I Thegeneralideaisthatwewillsegmentthepredictorspace intoanumberofsimpleregions. I Inordertomakeapredictionforagivenobservation,we ...
Related documents

Copyright © 2018 by Mark A Goss -Sampson.
static.jasp-stats.orgIf you need to edit the data in the spreadsheet just double click on a cell and the data should open up ... Remove all: analyses from the output window ... sensitive to outliers and skewed data : The . mode (20.0) is the most frequent value in the dataset and …

Revised IAP Growth Charts for Height, Weight and Body Mass ...
www.indianpediatrics.neturgent need to construct unified growth charts, adjusted for weight, for assessing the growth of contemporary ... chart as obvious outliers Out of remaining 33794, 646 (329 males) children were re-moved as they were above + 2 z score for weight for height ... Method used to remove children with unhealthy weights:

INDIAN AIR QUALITY PREDICTION AND ANALYSIS USING …
www.ripublication.comin order to remove the outliers. B.PRE-PROCESSING THE DATA In this dataset the outliers are mainly of faulty sensor or transmission errors, these errors have huge variation than the normal valid results. We know the standard range of pollutants occurs on a particular areaso to remove the outliers from the data we use boundary value analysis.

MULTIPLE REGRESSION EXAMPLE
www.ics.uci.edu129. We need to change the value to the missing value code, which is a period in Stata: replace momheight = . in 129 A case with height = 57 inches for a male. While unusual (4 ft, 9 inches) it is possible. Do not remove. A case with dadheight = 55 inches. Again this is very unusual (4 ft, 7 inches) but is possible. Do not remove.

Robust Principal Component Analysis?
www.columbia.eduperformance. In Section 4, we will show how our method is able to effectively remove such defects in face images. —Latent Semantic Indexing. Web search engines often need to analyze and index the content of an enormous corpus of documents. A popular scheme is the Latent Semantic Indexing (LSI) [Dewester et al. 1990; Papadimitriou et al. 2000 ...
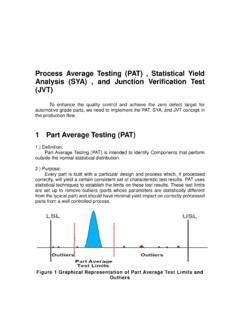
Process Average Testing (PAT) , Statistical Yield Analysis ...
www.issi.comThe lot of parts being tested must be held in a manner that allows the outliers to be removed after the test limits for the lot have been calculated and applied. 4.) Application on electrical tests Any electrical parameter with a Cpk greater than 2.0 (CPK = 2.0 = 6σ) is considered a candidate for implementation.

Chapter 335 Ridge Regression
ncss-wpengine.netdna-ssl.comOutliers. Extreme values or outliers in the X-space can cause multicollinearity as well as hide it. We call this outlier-induced multicollinearity. This should be corrected by removing the outliers before ridge regression is applied. Detection of Multicollinearity There are several methods of detecting multicollinearity. We mention a few. 1.

14.1 The Wilcoxon Rank Sum Test - University of Florida
users.stat.ufl.edumeasurement, for example, entitles you to remove the outlier and analyze the remaining data. If the outlier appears to be “real data,” it is risky to draw any conclusion from just a few observations. This is the advice we gave to the child development researcher in Example 2.19 (page 163). Sometimes we can our data so that their distribution is

SPSS Discriminant Function Analysis
kharazmi-statistics.irimportant outliers. 3. For our data, we conclude the groups do differ in their covariance matrices, violating an assumption of DA. 4. when n is large, small deviations from homogeneity will be found significant, which is why Box's M must be interpreted in conjunction with inspection of the log determinants. 23