Transcription of Process Average Testing (PAT) , Statistical Yield Analysis ...
1 Process Average Testing (PAT) , Statistical Yield Analysis (SYA) , and Junction Verification Test (JVT) To enhance the quality control and achieve the zero defect target for automotive grade parts, we need to implement the PAT, SYA, and JVT concept in the production flow. 1 Part Average Testing (PAT) 1.) Definition: Part Average Testing (PAT) is intended to identify Components that perform outside the normal Statistical distribution. 2.) Purpose: Every part is built with a particular design and Process which, if processed correctly, will Yield a certain consistent set of characteristic test results.
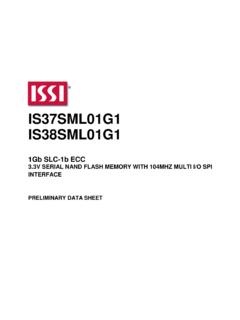
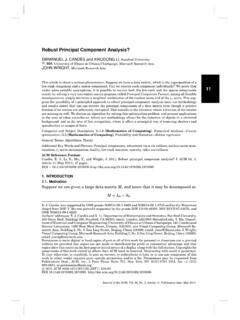
2 PAT uses Statistical techniques to establish the limits on these test results. These test limits are set up to remove outliers (parts whose parameters are statistically different from the typical part) and should have minimal Yield impact on correctly processed parts from a well controlled Process . Figure 1 Graphical Representation of Part Average Test Limits and outliers History has shown that parts with abnormal characteristics significantly contribute to quality and reliability problems. 3.) Method: a. Setting The Test Limits PAT Limits = Mean 6 sigma PAT test limits shall not exceed the device specification limits.
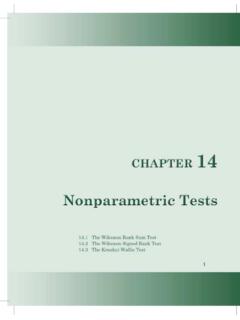
3 Test limits may be set in either a static or dynamic manner. New PAT limits (both static and dynamic) must be established when wafer level design changes, die shrinks or Process changes have been made. b. Static PAT limits The static limits are established based on an available amount of test data and used without modification for some period of time. Sample Size: Package parts: 30 pass parts at least 6 lots. Wafer level: 30 pass dies from at least 5 die located at least 6 lots. When data from six lots is not available, data from characterization lots may be used.
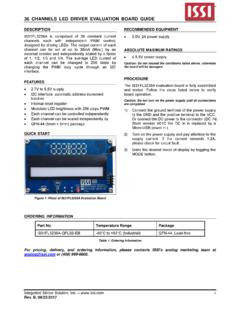
4 This data shall be updated as soon as production data is available. Figure 1 Determining Static PAT Limits The first 6 months: PAT test limits shall be reviewed and updated as required using current data of production or the last 8 lots. Older data shall not be used. After 6 months: The static PAT limits shall be reviewed and updated as needed on a quarterly (every 3 month) basis. c. Dynamic PAT limits The dynamic test limits are based on the static limits, but are established for each lot and continually change as each lot is tested.
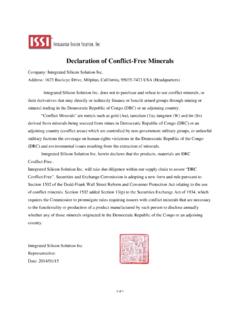
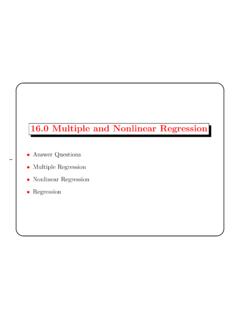
5 Sample Size: Same as Static PAT limits The dynamic limits shall not exceed the static limits. Dynamic PAT can provide tighter limits without causing rejection of good parts because it does not have to consider the lot -to-lot variation that is part of Static PAT Limits. This Analysis establishes new tighter test limits for that particular lot (or wafer) and removes additional outliers . Figure 2 Determining Dynamic PAT Limits The lot of parts being tested must be held in a manner that allows the outliers to be removed after the test limits for the lot have been calculated and applied.
6 4.) Application on electrical tests Any electrical parameter with a Cpk greater than (CPK = = 6 ) is considered a candidate for implementation. PAT limits should be used for all electrical tests if possible, but shall be established for at least the important characteristics as below : a. Junction Verification Test (JVT) - Pin Leakage Test b. Standby power supply current (IDD or ICC) c. IDDQ: tested with at least 70% transistor-level coverage (TLC). If the device design is not capable of being tested, then this requirement does not apply.
7 Breakdown voltage (BVCES or BVDSS) Output leakage (ICES or IDDS), measured at 80% of the breakdown voltage value Output current drive (IOUT) and output voltage levels (VOUT) e. Additional tests: 1) Voltage Stress Test (Vs) 2) Low Level Input Current (IIL) 3) High Level Input Current (IIH) 4) Propagation Delay Or Output Response Time 5) Rise/Fall Times 6) Low Level Output Voltage (VOL) 7) High Level Output Voltage (VOH) 8) Extended Operating Tests Extended operating tests are tests beyond the device specification requirements intended to increase the effectiveness of PAT.
8 The following are some examples of extended operating tests: a.) voltage stress b.) low voltage operation c.) high voltage operation d.) operating frequencies above specification requirements e.) operating frequencies below specification requirements on power devices, demonstration of safe operating capability at 60% of safe operating limit, followed by leakage Testing , etc. The only restriction on these tests is that it must be demonstrated that the test does not adversely affect the reliability of the part.
9 2 Statistical Yield Analysis (SYA) 1.) Definition: Statistical Yield Analysis (SYA) identifies lots of components that Yield abnormal distributions, or contain abnormal failure characteristics. 2.) Purpose: Utilizes Statistical techniques to identify a wafer, wafer lot, or component assembly lot that exhibits an unusually low Yield or an unusually high bin failure rate. Experience has shown that wafer and component assembly lots exhibiting these abnormal characteristics tend to have generally poor quality and can result insignificant system reliability and quality problems that impact the customer.
10 3.) Method: a. 2 ways: Statistical Yield limits (SYL) and Statistical bin limits (SBL) results. Both use test limits based on Part Average Testing (PAT) Limits. b. Sample Size: Collect data from at least six lots and determine the mean and sigma value for the percentage of devices passing per lot and the percentage of devices failing each bin-out per lot Early in production of a part, when data from six lots is not available, data from characterization/matrix lots may be used. This data shall be updated as soon as production data is available c.