Transcription of 2017-18 - CEA
1 2017 -18 L O A D G E N E R A T I O N B A L AN C E R E P O R T 2017 -18 G O V E R N M E N T O F I N D I A M I N I S T R Y O F P O W E R C E N T R A L E L E C T R I C I T Y A U T H O R I T Y ( , 2 0 0 3 73( ).)
2 ( I N F U L F I L L M E N T O F CE A S O B L I G A T I O N U N D ER S E C T I O N 7 3 ( A ) O F E L EC T R I C I T Y A C T , 2 0 0 3) S T U D E N T N A M E R O O M N U M B E R Central electricity Authority LGBR: 2017 -18 Ravindra Kumar Verma Chairperson Central electricity Authority Foreword The Load Generation Balance Report (LGBR) is brought out annually by Central electricity Authority towards fulfillment of its obligations under section 73(a) of the electricity Act, 2003. The annual Load Generation Balance Report (LGBR) for the year 2017 -18 is the thirty-sixth publication in the series brought out by CEA. The Report covers the month-wise anticipated energy requirement and availability (in MU) as well as peak demand and availability (in MW) for the year 2017 -18 considering all India annual generation target of BU, finalized by CEA and approved by Ministry of Power after detailed discussions with the States/ Utilities and Central/ State/ Private Generation Companies and availability from import of Power from Generation Projects in Bhutan and also availability from non-conventional and renewable energy sources in the country.
3 The report also brings out comparison of the actual Power Supply Position with the forecasted Power Supply Position indicated in LGBR for the year 2016-17. Central electricity Authority LGBR: 2017 -18 Assessment of unrestricted peak demand and unrestricted energy requirement and peak and energy availability of constituent states of each Region has been done by the respective Regional Power Committees (RPCs) after review of the projections made by the constituent states, past data and the trend analysis. The inputs provided by the RPCs have been analyzed and the anticipated month-wise power supply position for each State, Region and the Country has been prepared by CEA. As per this LGBR, the country is likely to experience energy surplus of and peak surplus of State-wise power supply position shows that most the states/UTs would be having surplus energy, and the remaining few states/UTs would need to arrange additional power from them to meet their peaking and/or energy shortages during 2017 -18.
4 During the year 2016-17, a total of 26,300 circuit-km (ckm) of transmission lines and 81,816 MVA transformation capacity was added in Central, State & Private Sector. This includes 2 nos. of 800kV HVDC line, 11 nos. of 765kV lines & 30 nos. of 400kV lines in Central Sector and 1 no. of 765kV, 33 nos. of 400kV & 147 nos. of 220kV lines in State Sector. Further, 4 nos. of 765kV, 22 nos. of 400kV & 2nos. of 220kV totaling 4,578 ckm of Transmission lines were added in Private Sector during this period. With the commissioning of these transmission lines, the inter-state and intra-state capability of power transfer in the country enhanced considerably. Further, a generating capacity addition of 13,405 MW has been considered in the LGBR for 2017 -18. These measures are expected to facilitate the deficit states to reduce / eliminate their shortages. I hope that the Load Generation Balance Report would provide valuable inputs to the Utilities for their operational planning, including bilateral tie-ups.
5 The report would enable the States/ Utilities to plan their power supply and demand so as to minimize the energy and peak shortages. The information on the anticipated power supply position in the various States would also be useful to those involved in the power trading. I would like to place on record my appreciation for special efforts made by Shri Dinesh Chandra, Chief Engineer, in supervising the entire exercise and Shri Vikram Singh, Director; Shri Annepu Suresh, Deputy Director and Shri Central electricity Authority LGBR: 2017 -18 Anshuman Swain, Assistant Director in compilation and bringing out this publication. Thanks are also due to Operation Performance Monitoring Division of CEA for setting the Generation Targets for the year 2017 -18 and the Member Secretaries of all the five RPCs along with their team for furnishing the requirement/ availability figures for 2017 -18 after having detailed discussions with the constituents of the concerned region.
6 Feedback from the users for improvement in the Report is welcome. New Delhi (Ravindra Kumar Verma) May, 2017 Central electricity Authority LGBR: 2017 -18 TABLE OF CONTENTS SL. NO CONTENTS PAGE Executive Summary i Anticipated PSP in the Country during 2017 -18 iii 1 INTRODUCTION 1 2 ACTUAL POWER SUPPLY POSITION DURING 2016-17 1 All India 1 Region-wise Actual Power Supply Position 2 State-wise Actual Power Supply Position 3 Month-wise Actual Power Supply Position 4 Power Supply from Central Generating Stations 4 3 ACTUAL POWER SUPPLY POSITION VERSUS LGBR FOR THE YEAR 2016-17 4 All India 4 Region-wise/ State-wise comparison of LGBR vs Actual Power Supply Position 5 4 LOAD GENERATION BALANCE REPORT FOR 2017 -18 9 Overview 9 Assessment of Power Supply Position for 2017 -18 10 Consultation with States/ UTs 12 Anticipated power supply position for 2017 -18 13 State-wise Power Supply Position 14 Central electricity Authority LGBR.
7 2017 -18 ANNEXURES Annex-I Month-wise power supply position of India in 2016-17 Annex-II Actual power supply position in terms of energy requirement vis- -vis energy availability of various States/ Systems during the year 2016-17 Annex-III Actual power supply position in terms of peak demand vis- -vis peak met of various States/ Systems during the year 2016-17 Annex IV(A) Month-wise power supply position of States/ UTs during the year 2016-17 (in terms of energy) Annex IV(B) Month-wise power supply position of States/ UTs during the year 2016-17 (in terms of peak) Annex-V Scheduled energy drawal by the States/ UTs vis- -vis their entitlement from Central Generating Stations during the year 2016-17 Annex-VI(A) Comparison of the constituent-wise forecast vis- -vis actual power supply position for the year 2016-17 (in terms of peak) Annex-VI(B) Comparison of the constituent-wise forecast vis- -vis actual power supply position for the year 2016-17 (in terms of energy) Annex-VII Maintenance schedule of Nuclear/ Thermal/ Hydro based power generating stations for the year 2017 -18 Annex-VIII Generating Schemes Expected to be commissioned during 2017 -18 Annex-IX Allocation of power from Central Generating Stations as on of the Northern, Western, Southern, Eastern and North Eastern Regions Annex-X Anticipated month-wise power supply position of All India during the year 2017 -18 Annex-XI(A) Anticipated month-wise power supply position of Northern Region during the year 2017 -18 Central electricity Authority LGBR.
8 2017 -18 Annex-XI(B) Anticipated month-wise power supply position of Western Region during the year 2017 -18 Annex-XI(C) Anticipated month-wise power supply position of Southern Region during the year 2017 -18 Annex-XI(D) Anticipated month-wise power supply position of Eastern Region during the year 2017 -18 Annex-XI(E) Anticipated month-wise power supply position of North Eastern Region during the year 2017 -18 Annex-XII Anticipated annual power supply position in each State/ UT for 2017 -18 Annex-XIII Anticipated month-wise power supply position of various States/ UTs for 2017 -18 EXHIBIT Exhibit - I Pattern of Peak Demand & Energy Requirement of the country and five Regions during 2012-13, 2013-14, 2014-15, 2015-16 and 2016-17 along with forecasted demand pattern for 2017 -18 Central electricity Authority LGBR: 2017 -18 EXECUTIVE SUMMARY Central electricity Authority LGBR: 2017 -18 i 1.
9 The assessment of the anticipated power supply position in the country during the year 2017 -18 has been made taking into consideration the power availability from various stations in operation, including non-conventional energy sources, fuel availability, and anticipated water availability at hydro-electric stations. A capacity addition of 13,405 MW during the year 2017 -18 comprising 11,366 MW of thermal, 1,539 MW of hydro and 500 MW of nuclear power stations has been considered. The gross energy generation in the country has been assessed as BU from the conventional power plants in operation and those expected to be commissioned during the year in consultation with generating companies/ SEBs and taking into consideration the proposed maintenance schedule of the units during the year. The monthly power requirements for all States/ UTs in terms of peak demand and energy requirement have been assessed considering the past trend and have been finalized in consultation with the concerned authorities taking into consideration the specific factors, if any.
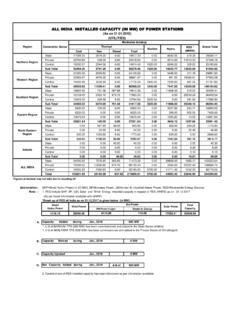
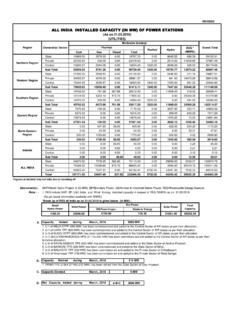
10 The anticipated power supply position of each state has been worked out and the assessment of anticipated surplus/ shortages has been made which has been discussed at the fora of Regional Power Committees. Based on the studies carried out as above, the anticipated power supply position of the country, region-wise emerges as presented in the Table below: Anticipated All India Power Supply Position for the year 2017 -18 State / Region Energy Peak Requirement Availability Surplus (+)/ Deficit (-) Demand Availability Surplus (+)/ Deficit (-) (MU) (MU) (MU) (%) (MW) (MW) (MW) (%) Northern 373,301 409,715 36,415 56,800 60,600 3,800 Western 366,956 414,595 47,639 48,842 57,224 8,382 Southern 323,146 347,051 23,905 44,908 45,355 447 Eastern 150,151 149,871 -280 21,577 23,743 2,166 North-Eastern 16,106 16,595 488 2,727 2,802 75 All India 1,229,661 1,337,828 108,167 169,130 180,601 11,471 Central electricity Authority LGBR: 2017 -18 ii 2.


![Electricity Regulation Act [No. 4 of 2006]](/cache/preview/6/a/5/5/a/0/d/5/thumb-6a55a0d556b9c34cf91d66ae31989ed3.jpg)