Transcription of 2018 STATISTICAL UPDATE Technical notes - hdr.undp.org
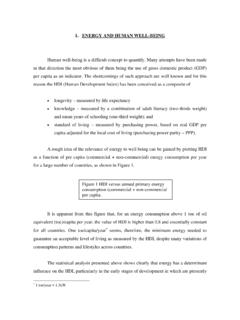
1 HUMAN DEVELOPMENT INDICES AND INDICATORS: 2018 STATISTICAL UPDATE . Technical notes Calculating the human development indices graphical presentation Human Development DIMENSIONS Long and healthy life Knowledge A decent standard of living Index (HDI). INDICATORS Life expectancy at birth Expected years Mean years GNI per capita (PPP $). of schooling of schooling DIMENSION Life expectancy index Education index GNI index INDEX. Human Development Index (HDI). Inequality-adjusted DIMENSIONS Long and healthy life Knowledge A decent standard of living Human Development Index (IHDI) INDICATORS Life expectancy at birth Expected years Mean years GNI per capita (PPP $). of schooling of schooling DIMENSION Life expectancy Years of schooling Income/consumption INDEX. INEQUALITY- Inequality-adjusted Inequality-adjusted Inequality-adjusted ADJUSTED life expectancy index education index income index INDEX.
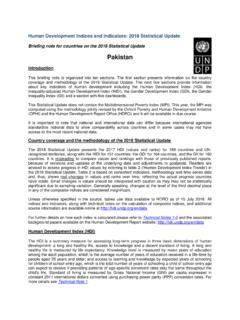
2 Inequality-adjusted Human Development Index (IHDI). Gender Development Female Male Index (GDI). DIMENSIONS Long and Standard Long and Standard healthy life Knowledge of living healthy life Knowledge of living INDICATORS Life expectancy Expected Mean GNI per capita Life expectancy Expected Mean GNI per capita years of years of (PPP $) years of years of (PPP $). schooling schooling schooling schooling DIMENSION. INDEX Life expectancy index Education index GNI index Life expectancy index Education index GNI index Human Development Index (female) Human Development Index (male). Gender Development Index (GDI). Gender Inequality DIMENSIONS Health Empowerment Labour market Index (GII). INDICATORS Maternal Adolescent Female and male population Female and male shares of Female and male mortality birth with at least parliamentary seats labour force ratio rate secondary education participation rates DIMENSION Female reproductive Female empowerment Female labour Male empowerment Male labour INDEX health index index market index index market index Female gender index Male gender index Gender Inequality Index (GII).
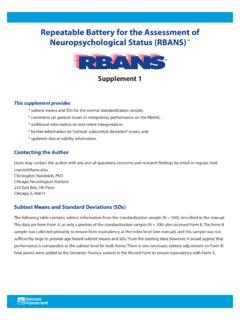
3 Multidimensional DIMENSIONS Health Education Standard of living Poverty Index (MPI). INDICATORS Nutrition Child mortality Years School Cooking fuel Toilet Water Electricity Housing Assets of schooling attendance POVERTY Intensity Headcount MEASURES of poverty ratio Multidimensional Poverty Index (MPI). Technical notes | 1. Technical note 1. Human Development Index The Human Development Index (HDI) is a summary measure improving living conditions and medical advances, life expec- of achievements in three key dimensions of human develop- tancy has already come very close to 85 years in several econo- ment: a long and healthy life, access to knowledge and a decent mies: Hong Kong, China (Special Administrative Region) ( standard of living. The HDI is the geometric mean of normal- years) and Japan ( years). ized indices for each of the three dimensions.
4 Societies can subsist without formal education, justifying the education minimum of 0 years. The maximum for expected years of schooling, 18, is equivalent to achieving a master's Data sources degree in most countries. The maximum for mean years of schooling, 15, is the projected maximum of this indicator for Life expectancy at birth: UNDESA (2017). 2025. Expected years of schooling: UNESCO Institute for Statis- The low minimum value for gross national income (GNI). tics (2018), ICF Macro Demographic and Health Surveys, per capita, $100, is justified by the considerable amount of United Nations Children's Fund (UNICEF) Multiple Indi- unmeasured subsistence and nonmarket production in econo- cator Cluster Surveys and OECD (2017). mies close to the minimum, which is not captured in the official Mean years of schooling: UNESCO Institute for Statistics data.
5 The maximum is set at $75,000 per capita. Kahneman (2018), Barro and Lee (2016), ICF Macro Demographic and and Deaton (2010) have shown that there is virtually no gain Health Surveys, UNICEF Multiple Indicator Cluster Sur- in human development and well-being from annual income per veys and OECD (2017). capita above $75,000. Currently, only four countries (Brunei GNI per capita: World Bank (2018), IMF (2018) and United Darussalam, Liechtenstein, Qatar and Singapore) exceed the Nations Statistics Division (2018). $75,000 income per capita ceiling. Having defined the minimum and maximum values, the dimension indices are calculated as: Steps to calculate the Human Development Index actual value minimum value . (1). Dimension index =. maximum value minimum value There are two steps to calculating the HDI. For the education dimension, equation 1 is first applied to Step 1.
6 Creating the dimension indices each of the two indicators, and then the arithmetic mean of the two resulting indices is taken. Using the arithmetic mean allows Minimum and maximum values (goalposts) are set in order to perfect substitutability between mean years of schooling and transform the indicators expressed in different units into indi- expected years of schooling. Many developing countries have ces between 0 and 1. These goalposts act as the natural zeros low school attainment among adults but are eager to achieve and aspirational targets, respectively, from which component universal primary and secondary school enrolment. indicators are standardized (see equation 1 below). They are set Because each dimension index is a proxy for capabilities in the at the following values: corresponding dimension, the transformation function from income to capabilities is likely to be concave (Anand and Sen Dimension Indicator Minimum Maximum 2000) that is, each additional dollar of income has a smaller Health Life expectancy (years) 20 85.
7 Expected years of schooling (years) 0 18. effect on expanding capabilities. Thus for income, the natural Education Mean years of schooling (years) 0 15 logarithm of the actual, minimum and maximum values is used. Standard of living Gross national income per capita (2011 PPP $) 100 75,000. Step 2. Aggregating the dimensional indices to produce the The justification for placing the natural zero for life expec- Human Development Index tancy at 20 years is based on historical evidence that no country in the 20th century had a life expectancy of less than 20 years The HDI is the geometric mean of the three dimensional (Maddison, 2010; Oeppen and Vaupel, 2002; Riley, 2005). indices: Maximum life expectancy is set at 85, a realistic aspirational tar- HDI = (IHealth . IEducation . IIncome) 1/3 . get for many countries over the last 30 years.
8 Due to constantly 2 | HUMAN DEVELOPMENT INDICES AND INDICATORS: 2018 STATISTICAL UPDATE . HUMAN DEVELOPMENT INDICES AND INDICATORS: 2018 STATISTICAL UPDATE . Example: Egypt rates of GDP are applied to the most recent GNI values in con- Indicator Value stant PPP terms. The IMF-projected growth rates are calculated Life expectancy at birth (years) based on local currency terms and constant prices rather than in Expected years of schooling (years) PPP terms. This avoids mixing the effects of the PPP conversion Mean years of schooling (years) with those of real growth of the economy. Gross national income per capita (2011 PPP $) 10,355. Official PPP conversion rates are produced by the Interna- Note: Values are rounded. tional Comparison Program, whose surveys periodically collect 20 thousands of prices of matched goods and services in many Health index = = countries.
9 The last round of this exercise refers to 2011 and 85 20. covered 199 countries. Expected years of schooling index = 0 = 18 0. Estimating missing values Mean years of schooling index = 0 = 15 0 For a small number of countries missing one of the four indi- cators, the HDRO estimated the missing values using cross- . Education index = + = country regression models. 2. In this UPDATE expected years of schooling were estimated for Bahamas, Dominica, Equatorial Guinea, Haiti, Libya, Papua Income index = ln(10,355) ln(100) = New Guinea, Tonga, Trinidad and Tobago, and Vanuatu. Mean ln(75,000) ln(100). years of schooling were estimated for Eritrea, Grenada and Saint Human Development Index = ( .. )1/3 = Kitts and Nevis. Country groupings Methodology used to express income The 2014 Human Development Report introduced fixed cutoff The World Bank's 2018 World Development Indicators data- points for four categories of human development achievements.
10 Base contains estimates of GNI per capita in constant 2011 The cutoff points (COP) are the HDI values calculated using the purchasing power parity (PPP) terms for many countries. For quartiles (q) from the distributions of the component indicators countries missing this indicator (entirely or partly), the Human (life expectancy at birth [LE], expected years of schooling [EYS], Development Report Office (HDRO) calculates it by con- mean years of schooling [MYS] and GNI per capita [GNIpc]): verting GNI per capita from current to constant terms using COPq = HDI (LEq, EYSq, MYSq, GNIpcq), q = 1,2,3.. two steps. First, the value of GNI per capita in current terms is converted into PPP terms for the base year (2011). Second, For example, LE1, LE2 and LE3 denote three quartiles of the a time series of GNI per capita in constant 2011 PPP terms is distribution of life expectancy across countries.