Transcription of 262-31: A Programmer's Introduction to the Graph …
1 1 Paper 262-31 A programmer s Introduction to the Graphics Template Language Jeff Cartier, SAS Institute Inc., Cary, NC ABSTRACT In SAS , the ODS Graphics Template Language (GTL) becomes production software. This powerful language is used by many SAS/STAT and SAS/ETS procedures (including the new SAS/ Graph procedures SGPLOT and SGSCATTER) to produce graphical output. The Graphics Template Language can also be used in conjunction with special DATA step features to produce graphs independently. This presentation helps you understand the basics of the Graph Template Language and create graphs with the DATA step. Topics include: Basic concepts: template definition and storage, compilation, and run-time actions Graphical Layouts: features of Gridded, Overlay, and Lattice layouts Common tasks: customizing axes and adding legends and titles ` Templates: making flexible templates by using dynamic and macro variables, conditional logic, and expressions Output: controlling image name, size, type, quality, and scaling Integration with ODS styles Introduction By now you are probably familiar with the ODS graphics that are automatically produced by many SAS statistical procedures in SAS 9 (see SUGI 31 paper 192-31 by Robert Rodriguez).
2 These procedures use compiled programs written in the Graphics Template Language (GTL) to produce their graphs. Such procedures have been designed so you do not need to know anything about GTL programming details to get this graphical output. GTL can be used by SAS application developers and other programmers to create sophisticated analytical graphics independent of the statistical procedures. This presentation helps you understand this new technology and shows the code for several types of graphs you can produce. The focus is on the organization and potential of this new language. TEMPLATE COMPILATION AND RUNTIME ACTIONS The DEFINE statement of PROC TEMPLATE allows you create specialized SAS files, called templates, that are used for controlling the appearance of ODS output.
3 The template types you are most familiar with are STYLE, TABLE, and TAGSET. Starting in SAS , a new experimental template type was added. A STATGRAPH template describes the structure and appearance of a Graph to be produced--similar to how a TABLE template describes the organization and content of a table. In SAS , the language that makes up the STATGRAPH template definition is production. All templates are stored compiled programs. Here is the source program that produces a very simple STATGRAPH template named SCATTER: proc template; define statgraph ; layout overlay; scatterplot x=height y=weight; endlayout; end; run; NOTE: STATGRAPH ' ' has been saved to: COMPILATION When the above code is submitted, the statement keywords and options are parsed, just as with any other procedure.
4 If no syntax error is detected, an output template named SCATTER is created and stored in the MYGRAPHS item store (physically in , by default). No Graph is produced. It should be noted that STATGRAPH syntax requires that any required arguments be specified (X= and Y= for the SCATTERPLOT statement), but no checking for the existence of these variables is done at compile time (also notice that no reference to an input data set appears in the template). TutorialsSUGI31 2 RUNTIME ACTIONS To produce a Graph , a STATGRAPH template must be bound to an ODS data object at runtime and directed to an ODS destination. The simplest way to do this is with the new SAS SAS/ Graph procedure called SGRENDER, which was created to simplify the execution of user-defined templates such as SCATTER: ods listing style=listing; proc sgrender data= template=" "; run; An ODS data object is constructed by comparing the template references to column names with variables that exist in the current data set.
5 Here, there is a match for HEIGHT and WEIGHT so they are added to the data object and other variables are ignored. It is possible for a template to define new computed columns based on existing columns. Once all the observations have been read, the data object and template definition are passed to a Graph renderer that produces an image file for the Graph which is then automatically integrated into the ODS destination. Rendering is totally independent of the legacy SAS/ Graph GRSEG generation. In this example, a GIF image is created in the LISTING destination. The visual properties of the Graph are determined by the ODS style in effect. You should note that the SCATTER template is a very restrictive definition in that it can only create a plot of variables named HEIGHT and WEIGHT.
6 As you will see later, STATGRAPH templates can be made more flexible by introducing dynamics or macro variables that allow variables and other information to be supplied at runtime. GRAPHICAL LAYOUTS One of most powerful features of the GTL is the syntax built around hierarchical statement blocks called layouts. A layout is a container that arranges its contents in cells. A cell may contain a plot, a title, a legend, or even another layout. The layout arranges the cells in a predefined manner--into a single cell with its contents superimposed or into rows or columns of cells. All STATGRAPH template definitions begin with a LAYOUT statement block. Single-cell Layouts that Support Superimposition Multi-cell Layouts in Rows and Columns of Cells OVERLAY 2D plots, legends, text GRIDDED Basic grid of plots and text; all cells independent OVERLAY3D 3D plots, text LATTICE Externalized axes, headers, sidebars OVERLAYEQUATED 2D plots, legends, text, axes haveequal sized units DATALATTICE Data-driven number of cells; 1-2 classifiers PROTOTYPE Simplified OVERLAY used in DATAPANEL and DATALATTICEDATAPANEL Data-driven number of cells; n classifiers THE OVERLAY LAYOUT The OVERLAY layout enables plots to be "stacked" in the order you declare them - with the first plot on the bottom of the stack.
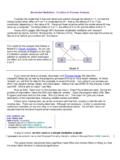
7 This layout manages the integration of plots based on different variables into single set of shared axes. proc template; define statgraph ; layout overlay; ellipse x=height y=weight/ alpha=.01 type=predicted; scatterplot x=height y=weight; endlayout; end; run; proc sgrender data= template=" "; run; In this case, the X and Y data ranges for prediction ellipse are larger than the data ranges for the scatter plot and the layout automatically adjusts the range for each axis. TutorialsSUGI31 3 THE GRIDDED LAYOUT The GRIDDED layout creates a single- or multi-cell Graph . It is primarily used to present multiple plots in a grid or to create a small table of text and statistics (inset) you want to embed in a Graph .
8 The cells are completely independent of one another. In this example, two OVERLAY layouts are nested in the GRIDDED layout to create a Graph with two cells placed in one column. proc template; define statgraph ; layout gridded / columns=1; layout overlay; ellipse x=height y=weight / clip=false alpha=.01 type=predicted; scatterplot x=height y=weight; entry "CLIP=FALSE" / autoalign=auto; endlayout; layout overlay; ellipse x=height y=weight / clip=true alpha=.01 type=predicted; scatterplot x=height y=weight; entry "CLIP=TRUE" autoalign=auto; endlayout endlayout; end; run; proc sgrender data= template=" "; run; An ENTRY statement overlays text in each plot.
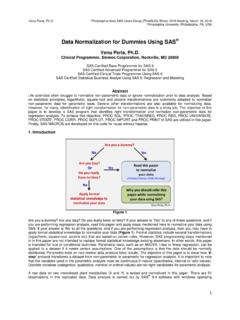
9 The AUTOALIGN=AUTO option allows the software to judge where to place the text so as to avoid collision with the data being plotted. From this example, you can see that CLIP=TRUE option requests that the ellipse boundaries be ignored when scaling the axes. THE LATTICE LAYOUT The LATTICE layout is a multi-cell layout with special features for combining data ranges of plots in columns or rows and externalizing axis information so it is not repeated in each cell. This layout and the OVERLAY are the most important and frequently used layouts. proc template; define statgraph ; layout lattice / columns=1 rows=2 rowweight=(.9 .1) columndatarange=union rowgutter=2px; columnaxes; latticeaxis / label='Score' ; endcolumnaxes; layout overlay / yaxisopts=(offsetmin=.)
10 03); entrytitle 'Distribution of Scores'; histogram score / scale=percent; densityplot score / normal( ) ; fringeplot score; endlayout; boxplot y=score / orient=horizontal; endlayout; end; run; This lattice has one column and two rows. The row cells contain an overlay consisting of a histogram, normal distribution curve, and "fringe plot" showing the location of individual observations under the histogram bins. a boxplot showing the median (line), mean (diamond marker), interquartile range, and outliers. The overlay is apportioned 90% of the available height and the boxplot 10%.