Transcription of 3.3 Graphing and Solving Systems of Linear Inequalities
1 Page 1 of 2156 chapter 3 Systems of Linear equations and InequalitiesGraphing and Solving Systemsof Linear InequalitiesGRAPHING ASYSTEM OFINEQUALITIESThe following is a in two +y 6 Inequality 12x y>4 Inequality 2A of a system of Linear Inequalities is an ordered pair that is a solution ofeach inequality in the system . For example, (3, 1) is a solution of the system of a system of Linear Inequalities is the graph of all solutions of you saw in the activity, a system of Linear Inequalities defines a region in a is a method for Graphing the of Linear inequalitiesGOAL1 Graph a system oflinear Inequalities to find thesolutions of the Systems oflinear Inequalities to solvereal-lifeproblems, such asfinding a person s targetheart rate zone in Example 3. To solve real-lifeproblems, such as finding outhow a moose can satisfy itsnutritional requirementsin Ex. you should learn itGOAL2 GOAL1 What you should graph a system of Linear Inequalities , do the following for each inequality inthe system : Graph the line that corresponds to the inequality.
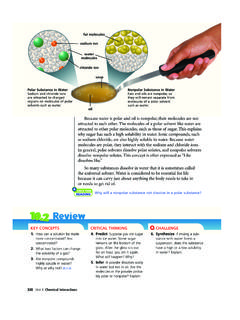
2 Use a dashed line for aninequality with < or > and a solid line for an inequality with or . Lightly shade the half-plane that is the graph of the inequality. Coloredpencils may help you distinguish the different graph of the system is the region common to all of the half-planes. If youused colored pencils, it is the region that has been shaded with A system OF Linear INEQUALITIESREALLIFEREALLIFEI nvestigating Graphs of Systems ofInequalitiesThe coordinate plane shows the four regionsdetermined by the lines 3x y= 2 and 2x+ y= 1. Use the labeled points to help you match each region with one of the Systems of y y 22x+ y 12x + y y y 22x+ y 12x + y 1 DevelopingConceptsACTIVITYyx23(4, 2)(1, 3)(1, 4)( 2, 1)3x y 22x y 1 Region 2 Region 3 Region 4 Region 1 Page 1 of and Solving Systems of Linear Inequalities157 Graphing a system of Two InequalitiesGraph the 3x 1 Inequality 1y< x+ 2 Inequality 2 SOLUTIONB egin by Graphing each Linear inequality.
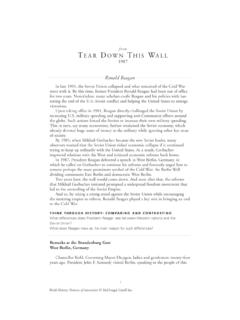
3 Use a different color for each instance, you can use red for Inequality 1 and blue for Inequality 2. The graph ofthe system is the region that is shaded .. You can also graph a system of three or more Linear a system of Three InequalitiesGraph the 0 Inequality 1y 0 Inequality 24x+ 3y 24 Inequality 3 SOLUTIONI nequality 1 and Inequality 2 restrict the solutions to the first quadrant. Inequality 3is the half-plane that lies on and below the line 4x+ 3y= 24. The graph of thesystem of Inequalities is the triangular region shown 2yx13 Shade the half-planeon and to the rightof y 3x 1 the half-planebelow y x graph of thesystem is theintersection of thered and 1xyx11 The inequality x 0implies that the regionis on and to the right ofthe inequality 4x 3y 24implies that the region is on andbelow the line 4x 3y inequality y 0implies that the region ison and above the 04x 3y 24y 0 STUDENTHELPLook Back For help with Graphing alinear inequality, see p.
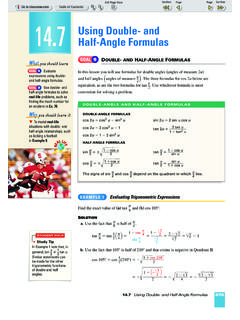
4 TipFrom this point on, only the solution regionwill be shaded on graphsof Systems of 1 of 2158 chapter 3 Systems of Linear equations and InequalitiesUSINGSYSTEMS OFINEQUALITIES INREALLIFEYou can use a system of Linear Inequalities to describe a real-life situation, as shownin the following and Using a system of InequalitiesHEARTRATEA person s theoretical maximum heart rate is 220 xwhere xis theperson s age in years (20 x 65). When a person exercises, it is recommendedthat the person strive for a heart rate that is at least 70% of the maximum and at most85% of the are making a poster for health class. Write and graph a system of linearinequalities that describes the information given 40-year-old person has a heart rate of 150 (heartbeats per minute) whenexercising. Is the person s heart rate in the target zone? yrepresent the person s heart rate. From the given information, you can writethe following four 20 Person s age must be at least 65 Person s age can be at most (220 x)Target rate is at least 70% of maximum (220 x)Target rate is at most 85% of maximum graph of the system is shown the graph you can see that the target zone for a 40-year-old person isbetween 126 and 153, inclusive.
5 That is,126 y 153. A 40-year-old person who has a heart rate of 150 is within the target 3 GOAL2 PERSONALTRAINERA personal trainer can helpyou assess your fitness leveland set exercise goals. Asdescribed in Example 3, oneway to do this is by moni-toring your heart ONCAREERSPage 1 of and Solving Systems of Linear must be true in order for an ordered pair to be a solution of a system oflinear Inequalities ? back at Example 1 on page 157. Explain why the ordered pair ( 1, 5) isnota solution of the what is wrong with the graph of the following system 3x+ y 5 Tell whether the ordered pair is a solution of the following 1y> 2x+ 24.( 1, 2)5.(0, 0)6.(1, 4)7.(2, 7)Graph the system of Linear +y >0y> 2x+ 2y>1y x be a flight attendant, you must be at least 18years old and at most 55 years old, and you must be between 60 and 74 inchestall, inclusive. Let xrepresent a person s age (in years) and let yrepresent aperson s height (in inches). Write and graph a system of Linear inequalitiesshowing the possible ages and heights for flight ASOLUTIONTell whether the ordered pair is a solution of (25, 5)13.
6 (2, 3)14.(2, 6)FINDING ASOLUTIONGive an ordered pair that is a solution of the y +y< >yy<15x 2x > xy<10x>3y 0x<y2x+y<13x<0yx42yx11yx515 PRACTICEANDAPPLICATIONSGUIDEDPRACTICEV ocabulary Check Concept Check Skill Check STUDENTHELPE xtra Practice to help you masterskills is on p. HELPE xample 1:Exs. 12, 13, 15 17, 21, 22, 27 38 Example 2:Exs. 14,18 20, 23 26, 39 50 Example 3:Exs. 51 5811x + y = 5y = 3 Page 1 of 2160 chapter 3 Systems of Linear equations and InequalitiesMATCHINGSYSTEMS ANDGRAPHSM atch the system of Linear inequalitieswith its > > xx> 2x> 2x> 3y > > 1y> 3y> 1x 1x 0y x+ 1y x+ OFTWOINEQUALITIESG raph the system of Linear < > 0x> 4y 1x+y< + y > 2x 7 5x+ y< 3y< 2x+ 104x+ 4y< < x+ +y> > 3xy 2x+ 1x+y 6x y> + y> 038. x< y2x+ y< 83x 2y 5x+ 3y> 8 Systems OFTHREE ORMOREINEQUALITIESG raph the system of Linear < 3y> 6x> 3x 65x 3y< 3y> xy< 2x 5x+ 3y> 4y> + 1 3y 4x+ y 1x <5x+y< 8x+ 3y> 1y <x+ 2y> y y 0x+y> 1x 4y < 2y< 2xx< 10y< x5x+ 6y + y < 5x 9x + y 1y> 6x+y<15x y 22x+y 1y <xx y 2y x+ 31y1x11yx22yxyx11yx11yx34 HOMEWORK HELPV isit our Web help with Exs.
7 21 1 of 2 RONNY WELLERof Germany set theworld records for the snatchlift and combined lift in records for these lifts arelisted in the table for Ex. has won 3 Olympicmedals: one gold, one silver,and one are a lifeguard at a community pool, and you arein charge of maintaining the proper pH (amount of acidity) and chlorine water test-kit says that the pH level should be between and pH unitsand the chlorine level should be between and PPM (parts per million).Let pbe the pH level and let cbe the chlorine level (in PPM). Write and graph asystem of Inequalities for the pH and chlorine levels the water should Exercises 52 54, use the following a healthy person who is 4 feet 10 inches tall, the recommended lower weightlimit is about 91 pounds and increases by about pounds for each additional inchof height. The recommended upper weight limit is about 119 pounds and increasesby about pounds for each additional inch of height. Source: Dietary Guidelines Advisory xbe the number of inches by which a person s height exceeds 4 feet 10 inches and let ybe the person s weight in pounds.
8 Write a system ofinequalities describing the possible values of xand yfor a healthy a Graphing calculator to graph the system of Inequalities from Exercise is the recommended weight range for someone 6 feet tall?SHOESALEIn Exercises 55 and 56, use the shoe store ad shown xbe the regular footwear price and ybe the discount price. Write a system of Inequalities for the regular footwear prices and possible sale the system you wrote in Exercise 55. Use your graph to estimate the range of possible sale prices for shoes that are regularly priced at $ men s world weightlifting records for the105-kg-and-over weight category are shown in the table. The combined lift is thesum of the snatch lift and the clean and jerk lift. Let sbe the weight lifted in thesnatch and let j be the weight lifted in the clean and jerk. Write and graph asystem of Inequalities to describe the weights you could lift to break the recordsfor both the snatch and combined lifts, but notthe clean and jerk day, an average adult moose can process about 32 kilograms of terrestrial vegetation (twigs and leaves) and aquatic this food, it needs to obtain about grams of sodium and 11,000 Caloriesof energy.
9 Aquatic vegetation has about gram of sodium per kilogram andabout 193 Calories of energy per kilogram, while terrestrial vegetation hasminimal sodium and about four times more energy than aquatic vegetation. Writeand graph a system of Inequalities describing the amounts t and aof terrestrialand aquatic vegetation, respectively, for the daily diet of an average adult moose. Source: Biology by and Solving Systems of Linear Inequalities161 Men s +105 kg World Weightlifting RecordsSnatchClean & kgSave(Regular price:$20 $80)on all athletic 25%HUGEONE-DAY SALE!DATA UPDATE of International Weightlifting Federation data at INTERNETKEYSTROKE HELPV isit our Web see keystrokes forseveral models 1 of 2162 chapter 3 Systems of Linear equations and a system of three Linear Inequalities that has nosolution. Graph the system to show that it has no system of Inequalities isgraphed at the right? Ax+ y> 5 Bx+ y> 5 2x+ y 3 2x+ y< 3 Cx+ y> 5 Dx+ y> 5 2x+ y 3 2x+ y> ordered pair is nota solution of the followingsystem of Inequalities ?
10 3x+ 2y 2x y< 3 A(0, 0) B( 1, 2) C(4, 1) D(2, 2)WRITING ASYSTEMW rite a system of Linear Inequalities for the a system of Linear Inequalities whose graph is a pentagon and its the expression for the given values of xand y. (Review for ) + 7ywhen x= 5 and y= 367. 4x 3ywhen x= 6 and y= 3ywhen x= 4 and y= 269. y+ 8xwhen y= 3 and x= 2 DETERMININGCORRELATIONTell whether xand yhave a positive correlation,a negative correlation, or relatively no correlation. (Review ) AMETHODS olve the system using any algebraic method. (Review ) + 5y= 274. 2x+ 7y= +6y= 12x 4y= 10x 3y= 310x+12y=2476. 7x+ 5y= 077. 4x 10y= 8y= 1814x 8y= 2x+ 5y= 2 3x+4y=9yxyxyxMIXEDREVIEW3yx3( 3, 15)( 6, 3)(3, 9)9yx12(0, 3)(9, 3)( 4, 1)(5, 1)2yx(1, 3)(8, 3)(1, 5)(8, 5)4 TestPreparation