Transcription of 32.3 Taguchi’s Robust Design Method
1 IE 466: Concurrent EngineeringT. W. Taguchi s Robust Design MethodSince 1960, Taguchi methods have been used for improving the quality of Japaneseproducts with great success. During the 1980 s, many companies finally realized that the oldmethods for ensuring quality were not competitive with the Japanese methods. The old methodsfor quality assurance relied heavily upon inspecting products as they rolled off the productionline and rejecting those products that did not fall within a certain acceptance range.
2 However,Taguchi was quick to point out that no amount of inspection can improve a product; quality mustbe designed into a product from the start. It is only recently that companies in the United Statesand Europe began adopting Taguchi s Robust Design approaches in an effort to improve productquality and Design is Robust Design ? Robust Design is an engineering methodology for improvingproductivity during research and development so that high-quality products can be producedquickly and at low cost (Phadke, 1989).
3 The idea behind Robust Design is to improve the qualityof a product by minimizing the effects of variation without eliminating the causes (since they aretoo difficult or too expensive to conrol). His Method is an off-line quality control Method that isinstituted at both the product and process Design stage to improve product manufacturability andreliability by making products insensitive to environmental conditions and component end result is a Robust Design , a Design that has minimum sensitivity to variations inuncontrollable Genichi Taguchi bases his Method on conventional statistical tools together withsome guidelines for laying out Design experiments and analyzing the results of theseexperiments.
4 Taguchi's approach to quality control applies to the entire process of developingand manufacturing a product from the initial concept, through Design and engineering, tomanufacturing and production. Taguchi methods are used to specify dimension and featuredetail and normally follow DFM activities. In the next section we discuss Taguchi s concept of aquality loss function. This is then followed by a detailed description of Taguchi s approach toparameter Taguchi s Quality Loss FunctionConsider the popular story of Sony and two of their television production facilities, onein the USA, the other in Japan.
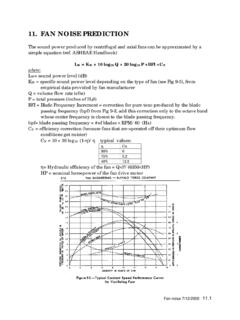
5 The color density of the televisions manufactured by Sony-USAwere uniformly distributed and fell within the tolerance limits, m 5 ( where m is the target forcolor density), while the televisions from Sony-Japan followed a normal distribution, moretelevisions were on target but about fell outside of the tolerance limits. The color densitydistributions are illustrated in Figure 1. The differences in customer perceptions of qualityresulted from Sony-USA paying attention only to meeting the tolerances whereas in Sony-Japan,the focus was on meeting the target and minimizing the variance around that target.
6 If we assigna grade to each television based on its color density as done in Figure 12, then we see that Sony-Japan produced many more Grade A sets and fewer Grade C sets in comparison to , a much larger portion of Sony-Japan's televisions receive higher grades then those madeby Sony-USA; hence, the customer s preferred the televisions sets produced by Sony-Japan overthose produced by 466: Concurrent EngineeringT. W. Simpson2 Figure 1 Color Density Distribution of Television Sets (Phadke, 1989)To measure quality, Taguchi defines a Quality Loss Function.
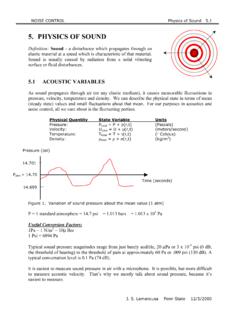
7 The quality loss functionis a continuous function that is defined in terms of the deviation of a Design parameter from anideal or target value, see Figure 2b. Taguchi s view on the nature of the quality loss functionrepresents a fundamental paradigm shift (particularly in the ) in the way in whichmanufacturers consider whether or not a product is good. The traditional approach employed manufacturers (as evidenced by Sony-USA) has been to use a step function that ensuresthat performance fell within the upper and lower specification limits as shown in Figure 2 Quality Loss Function (Phadke, 1989)Taguchi s loss function can be expressed in terms of the quadratic relationship.
8 L = k (y - m)2[ ]where y is the critical performance parameter value, L is the loss associated with a particularparameter y, m is the nominal value of the parameter specification, k is a constant that dependson the cost at the specification limits (can be determined conservatively by dividing the cost ofscrap in $, by the square of the lower or higher tolerance values). This function penalizes thedeviation of a parameter from the specification value that contributes to deteriorating theperformance of the product, resulting in a loss to the customer.
9 The key here is that a productengineer has a good understanding of what the nominal size of the specification is. The usuallower and upper limits for the tolerance of a given Design parameter are changed to a continuousfunction that presents any parameter value other than the nominal as a loss. The loss functiongiven in is referred to as nominal is best, but there are also expressions for cases whenhigher or lower values of parameters are better (Phadke, 1989).IE 466: Concurrent EngineeringT.
10 W. Simpson3If a large number of parts are considered, say N, the average loss per part is equal to thesummation of the losses given by Eq. for each part, divided by the total N. The averagequality loss results from deviation around the average value of y from the target and the meansquare deviation of y around its own mean. The average quality loss can be expressed as:L = k[S2 + ( - m)2][ ]where is the average value of y for the set of parts, and S2 is the variance around the minimize loss, the traditional approach is to monitor the process variables duringproduction and adjust the process to reduce manufacturing imperfections so that responseparameters fall within the specified tolerances.