Example: marketing
3D Graphics in MATLAB - UPC Universitat Politècnica de ...
coordinates are the elements of x, y and z. PLOT3(X,Y,Z), where X, Y and Z are three matrices of the same size, plots several lines obtained from the columns of X, Y and Z. Various line types, plot symbols and colors may be obtained with PLOT3(X,Y,Z,s) where s is a 1, 2 or 3 character string made from the characters listed under the
Tags:
Information
Domain:
Source:
Link to this page:
Documents from same domain
Armonía Musical - Departament de Matemàtiques
web.mat.upc.edu2.3 Renacimiento 2.3.1 EL AUGE DE LOS INTERVALOS DE TERCERA Y SEXTA Hasta el siglo XIV, la actitud hacia la consonancia entre compositores continentales se unió al ideal pitagórico, que aceptó como consonancias sólo las relaciones numØricas mÆs simples (cuartas, quintas y octavas).

Mathematics 1 Part I: Graph Theory
web.mat.upc.eduThe problems of this collection were initially gathered by Anna de Mier and Montserrat Mau-reso. Many of them were taken from the problem sets of several courses taught over the years by the members of the Departament de Matem atica Aplicada 2. Other exercises came from the bibliography of the course or from other texts, and some of them were new.

ECUACIONES DIFERENCIALES
web.mat.upc.edude resoluci on para algunos tipos particulares de ecuaciones de primer orden; analizando, tambi en, algunas aplicaciones de los casos estudiados, mediante la presentaci on de modelos matem aticos de ciertos fen omenos. Seguidamente se estudiar an los teoremas de existencia y unicidad de soluciones y su prolongaci on anal tica
Related documents
POLAR COORDINATES: WHAT THEY ARE AND HOW TO …
noodle.med.yale.edu2.4. Some properties of polar coordinates. There are some aspects of polar coordinates that are tricky. You should pay attention to the following: 1. Two different polar coordinates, say (r 1,θ 1) and (r 2,θ 2), can map to the same point. This can happen in the following ways: (a) It can happen if r 2 = r 1 and θ 2 = θ 1 ± 2πn for any ...

fx-570ES PLUS fx-991ES PLUS Users Guide Eng
support.casio.comusing the same format as they are written on paper. LineO displays input the same way as MathO, but calculation results are displayed in linear format. Linear Display ... ( a + b i ) or polar coordinates ( r ∠ ) for EQN Mode solutions. c4STAT 1ON ; 2OFF Specifies whether or not to display a FREQ

Surveying made easy - Argonne National Laboratory
www.aps.anl.govCoordinates In order to describe the position of a point, two coordinates are required. Polar coordinates need a line and an angle. Cartesian coordinates need two lines within an orthogonal system. The total station measures polar coordinates; these are recalculated as Cartesian coordinates within the given orthogonal system, either within the ...
6 Wave equation in spherical polar coordinates
www2.ph.ed.ac.uk6 Wave equation in spherical polar coordinates We now look at solving problems involving the Laplacian in spherical polar coordinates. The angular dependence of the solutions will be described by spherical harmonics. We take the wave equation as a special case: ∇2u = 1 c 2 ∂2u ∂t The Laplacian given by Eqn. (4.11) can be rewritten as: ∇ ...

TM Electronic Polar Scope Operation Manual
www.ioptron.comWhen they are close enough, the software will be in the zoom mode for easy adjustment. NOTE: It is suggested to set the mount to Zero Position so the virtual pole movement direction corresponds to the alt/azi adjustment. 4.6. Complete Polar Alignment When the circle overlaps the cross, they will change to green and the polar alignment is completed.
A Tutorial on Euler Angles and Quaternions
www.weizmann.ac.il2.1 Cartesian and polar coordinates A vector or a position (the tip of the vector) in a two-dimensional space can be given either in cartesian coordinates (x,y) or in polar coordinates (r,f), relative to a frame of reference: f r y x The formulas for transforming one representation to another are: x = r cosf y = r sinf r = q x2 +y2 f = tan 1 y x.
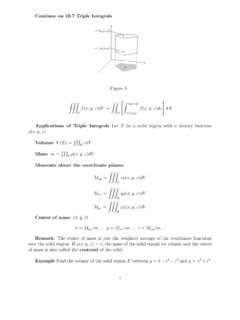
Contiune on 16.7 Triple Integrals - University of Notre Dame
www3.nd.edu16.8 Triple Integrals in Cylindrical and Spherical Coordinates 1. Triple Integrals in Cylindrical Coordinates A point in space can be located by using polar coordinates r,θ in the xy-plane and z in the vertical direction. Some equations in cylindrical coordinates (plug in x = rcos(θ),y = rsin(θ)): Cylinder: x2 +y2 = a2 ⇒ r2 = a2 ⇒ r = a;
Lectures on Vector Calculus - CSUSB
physics.csusb.eduinstead. (They are called ‘indices’ because they index something, and they are called ‘dummy’ because the exact letter used is irrelevant.) In index notation, then, I claim that the conditions (1.1) and (1.2) may be written e^ i^e j = ij: (1.3) How are we to understand this equation? Well, for starters, this equation

Mach3 G-Code Manual - MachMotion
machmotion.comMar 27, 2013 · Flood coolant and mist coolant may each be turned on independently. They are turned off together. 1.9 Dwell A machining system may be commanded to dwell (i.e., keep all axes unmoving) for a specific amount of time. The most common use of dwell is to break and clear chips or for a spindle to get up to speed. The

Quantum Mechanics: The Hydrogen Atom - University of …
www1.udel.eduRecall they are dependent on the principle quantum number only. III. Spectroscopy of the Hydrogen Atom Transitions between the energy states (levels) of individual atoms give rise to characteristic atomic spectra. These spectra can be used as analytical tools to assess composition of matter. For instance, our knowledge of the atomic composition ...