Transcription of 5. Phase Transitions
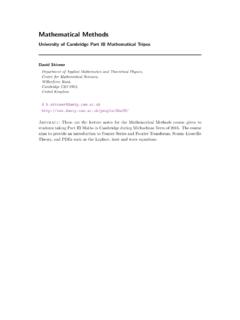
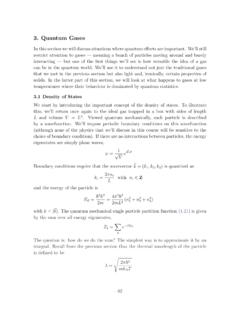
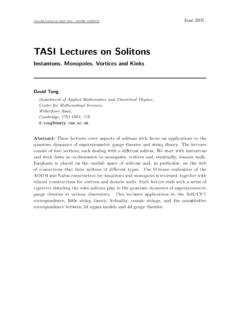
1 5. Phase TransitionsAphase transitionis an abrupt, discontinuous change in the properties of a ve already seen one example of a Phase transition in our discussion of Bose-Einsteincondensation. In that case, we had to look fairly closely to see the discontinuity: it waslurking in the derivative of the heat capacity. In other Phase Transitions many ofthem already familiar the discontinuity is more manifest. Examples include steamcondensing to water and water freezing to this section we ll explore a couple of Phase Transitions in some detail and extractsome lessons that are common to all Liquid-Gas TransitionRecall that we derived the van der Waals equation of state for a gas ( ) b av2( )wherev=V/Nis the volume per particle. In the literature, you will also see thisequation written in terms of the particle density =1 the right we fixTat di erent valuesbpvT>TT=TT<TccccFigure 34:and sketch the graph the van der Waals equation.
2 These curvesareisotherms line of constant we can see from the diagram, the isothermstake three di erent shapes depending on thevalue large values ofT. Here we can e ectivelyignore the a/v2term. (Recall thatvcan-not take values smaller thanb,reflectingthefact that atoms cannot approach to arbitrar-ily closely). The result is a monotonically decreasing function, essentially the same aswe would get for an ideal gas. In contrast, whenTis low enough, the second term in( ) can compete with the first term. Roughly speaking, this happens whenkBT a/vis in the allowed regionv> ,theisothermhas a wiggle. 135 At some intermediate temperature, the wiggle must flatten out so that the bottomcurve looks like the top one. This happens when the maximum and minimum meetto form an inflection point. Mathematically, we are looking for a solution todp/dv=d2p/dv2=0.
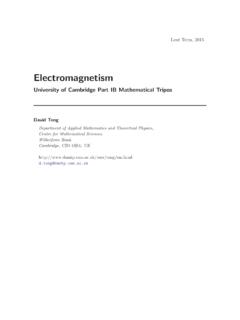
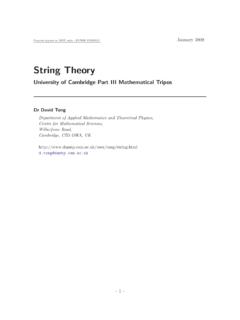
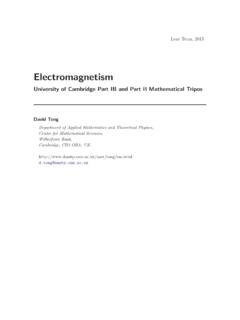
3 Itissimpletocheckthatthesetwoequationson lyhaveasolutionatthecritical temperatureT=Tcgiven bykBTc=8a27b( )Let s look in more detail at theT<Tccurve. For a range of pressures, the system canhave three di erent choices of volume. A typical, albeit somewhat exagerated, exampleof this curve is shown in the figure below. What s going on? How should we interpretthe fact that the system can seemingly live at three di erent densities =1/v?First look at the middle solution. This hasbpT<TcvFigure 35:some fairly weird properties. We can see from thegraph that the gradient is positive:dp/dv|T> means that if we apply a force to the con-tainer to squeeze the gas, the pressure gas doesn t push back; it just relents. But ifwe expand the gas, the pressure increases and thegas pushes harder. Both of these properties aretelling us that the gas in that state is we were able to create such a state, it wouldn t hand around for long because anytiny perturbation would lead to a rapid, explosive change in its density.
4 If we want tofind states which we are likely to observe in Nature then we should look at the othertwo solution to the left on the graph hasvslightly bigger ,recallfromour discussion of the closest that the atoms can get. If we havev b,thentheatomsareverydenselypacked. Moreover,wecanalsoseefromthegraph that|dp/dv|is very large for this solution which means that the state is verydi cult to compress: we need to add a great deal of pressure to change the volumeonly slightly. We have a name for this state: it is may recall that our original derivation of the van der Waals equation was validonly for densities much lower than the liquid state. This means that we don t reallytrust ( ) on this solution. Nonetheless, it is interesting that the equation predictsthe existence of liquids and our plan is to gratefully accept this gift and push aheadto explore what the van der Waals tells us about the liquid-gas transition .
5 We will seethat it captures many of the qualitative features of the Phase transition . 136 The last of the three solutions is the one on the right in the figure. This solution hasv band small|dp/dv|.Itisthegas between the liquid and gas state. We know that the naive, middle, solution given tous by the van der Waals equation is unstable. What replaces it? Phase EquilibriumThroughout our derivation of the van der Waals equation in ,weassumedthat the system was at a fixed density. But the presence of two solutions the liquidand gas state allows us to consider more general configurations: part of the systemcould be a liquid and part could be a do we figure out if this indeed happens? Just because both liquid and gas statescan exist, doesn t mean that they can cohabit. It might be that one is preferred overthe other.
6 We already saw some conditions that must be satisfied in order for twosystems to sit in equilibrium back in guaranteed if two systems have the same pressure and temperature both of these are already guaranteed by construction for our two liquid and gassolutions: the two solutions sit on the same isotherm and at the same value releft with only one further requirement that we must satisfy which arises because thetwo systems can exchange particles. This is the requirement of chemical equilibrium, liquid= gas( )Because of the relationship ( )betweenthechemicalpotentialandtheGibbsf reeenergy, this is often expressed asgliquid=ggas( )whereg=G/Nis the Gibbs free energy per that all the equilibrium conditions involve only intensive quantities:p,Tand . This means that if we have a situation where liquid and gas are in equilibrium, thenwe can have any numberNliquidof atoms in the liquid state and any numberNgasinthe gas state.
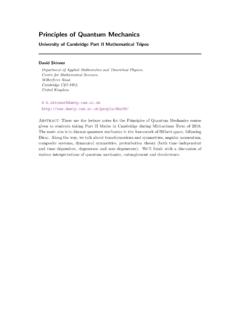
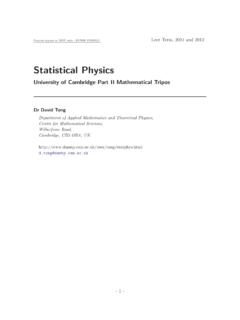
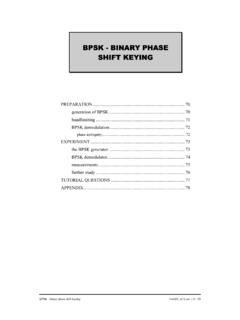
7 But how can we make sure that chemical equilibrium ( )issatisfied?Maxwell ConstructionWe want to solve liquid= : = (p, T). Importantly, we won t assume that (p, T)issinglevaluedsincethat would be assuming the result we re trying to prove! Instead we will show that ifwe fixT,thecondition( )canonlybesolvedforaveryparticularvalueo fpressure 137 ,startintheliquidstateatsomefixedvalueof pandTand travel alongthe isotherm. The infinitesimal change in the chemical potential isd =@ @p TdpHowever, we can get an expression for@ /@pby recalling that arguments involvingextensive and intensive variables tell us that the chemical potential is proportional tothe Gibbs free energy:G(p, T, N)= (p, T)N( ). Looking back at the variation ofthe Gibbs free energy ( )thentellsusthat@G@p N,T=@ @p TN=V( )Integrating along the isotherm then tells us the chem-bpT<TcvFigure 36:ical potential of any point on the curve, (p, T)= liquid+Zppliquiddp0V(p0,T)NWhen we get to gas state at the same pressurep=pliquidthat we started from, the condition for equi-librium is = liquid.
8 Which means that the integralhas to vanish. Graphically this is very simple to de-scribe: the two shaded areas in the graph must have equal area. This condition, knownas theMaxwell construction, ssomethingslightlydodgyabouttheMaxwellco nstruc-tion. We already argued that the part of the isotherm withdp/dv >0su ersaninstability and is unphysical. But we needed to trek along that part of the curve toderive our result. There are more rigorous arguments that give the same each isotherm, we can determine the pressure at which the liquid and gas statesare in equilibrium. The gives us theco-existence curve, ,liquidandgascanbothexistatthesametemper atureand pressure. But there is nothing that tells us how much gas there should be and howmuch liquid: atoms can happily move from the liquid state to the gas state. This meansthat while the density of gas and liquid is fixed, theaveragedensity of the system isnot.
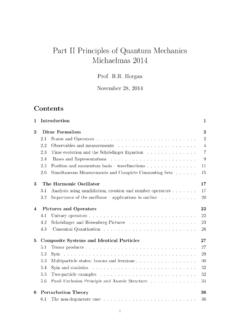
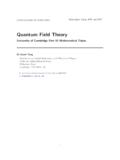
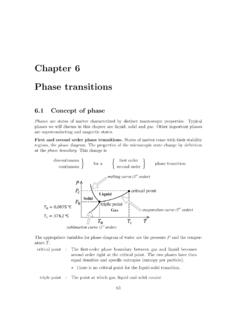
9 It can vary between the gas density and the liquid density simply by changing theamount of liquid. The upshot of this argument is that inside the co-existence curves,the isotherms simply become flat lines, reflecting the fact that the density can take anyvalue. This is shown in graph on the right of Figure37. 138 pvcT=TpvcT=TFigure 37:The co-existence curve in red, resulting in constant pressure regions consistingof a harmonious mixture of vapour and illustrate the physics of this situation, suppose that we sitFigure 38:at some fixed density =1/vand cool the system down from ahigh temperature toT<Tcat a point inside the co-existence curveso that we re now sitting on one of the flat lines. Here, the systemis neither entirely liquid, nor entirely gas. Instead it will split intogas, with density 1/vgas,andliquid,withdensity1/vliquidso that theaverage density remains 1 minimum energy configuration will typically be a single Phase ofliquid and one of gas because the interface between the two costs energy.
10 (We will derivean expression for this energy in ). The end result is shown on the right. Inthe presence of gravity, the higher density liquid will indeed sink to the StatesWe ve understood what replaces the unstable regionvpFigure 39:of the van der Waals Phase diagram. But we seem to haveremoved more states than anticipated: parts of the Vander Waals isotherm that haddp/dv <0arecontainedinthe co-existence region and replaced by the flat pressurelines. This is the region of thep-Vphase diagram thatis contained between the two dotted lines in the figure tothe right. The outer dotted line is the co-existence inner dotted curve is constructed to pass through thestationary points of the van der Waals isotherms. It iscalled thespinodial curve. 139 The van der Waals states which lie between the spinodial curve and the co-existencecurve are good states.