Transcription of First Order Phase Transitions
1 Physics 127b: Statistical MechanicsLecture 3: First Order Phase TransitionsThe van der Waals equation for a gas ishPCaV2i[V b]DNkBT:(1)(The variableais proportional toN2andbtoN, ;Nbconstants).It can be motivated by rewriting it in the formPDNkBTV b aV2(2)TheV bterm comes from estimating the free volume available for the molecules by excludinga hard core contribution, and thea=V2is a reduction in the pressure proportional to the densitysquared, representing the attractive interaction of the molecules. InLecture 2we derived expressionsforNaandNbin terms of the pair corresponding free energy isADAideal NkTln 1 bV aV(3)withAidealthe ideal gas expression.
2 (Actually, if we integratePD .@A=@V/N;Tto getAthereis an integration constant ;T/, and we fix this by comparing with the ideal gas expressionforV!1.) The second term is Ttimes theentropy correctionfrom the excluded volume, andthe third term is theenergy correctionfrom the attractive > Visotherms do not look much different from those for theideal gas. However, atTDTcthe isotherm develops an inflection point atPcDa=27b2; pointPc;Vc;Tcdefines thecritical pointof the liquid gas transition . Incidentally, in terms ofvariables reduced to these critical values,PrDP=Pc;VrDV=Vc;TrDT=Tcthe van der Waalsequation takes the form PrC3V2r Vr 13 D83Tr(4)so that all liquid gas systems should look the same in these reduced variables.
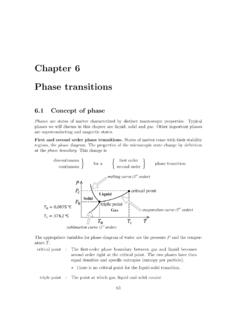
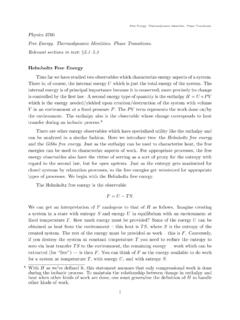
3 This qualitativestatement is known as the law of corresponding states, and is actually more general than thisderivation from the van der Waals equation it depends on the assumption of pairwise potentials,and on there being a single energy and length scale parameterization of the interaction < becomes non-monatomic the isotherm forT'0:94 Tcis plotted inFig. (1).We immediately recognize that the (red) dashed portion of the curve is linearlyunstablesince.@P=@V/ >0. As we discussed in lecture 11 last term, further constraints are given by theconvexityrequirement on the Helmholtz free energy, Fig.
4 (2a). The dashed (red) portion of thecurve, where the curvature is negative, corresponds to the obviously unstable dashed portion oftheP Visotherm. But now we see that the dotted (green) portion is also unstable by the chord1 PVFigure 1: Isotherms of the van der Waals 2: Thermodynamic potentials of the van der Waals We recognize from the discussion of the instability that the system willphase separateinto two macroscopic regions of high density ( lDN=Vl) liquid and low density ( gDN=Vg)gas Phase with properties given by the endpoints of the common tangent construction to The fractionfl;fg(withflCfgD1) of the total numberNin each Phase when the systemvolume is at some volumeV1in this mixed Phase region is given byflVlCfgVgDV1H)flDVg V1Vg Vl:(5)The free energy is consistent with the given by thecommon tangentconstruction: the is given by the solid (black-blue-black) curve in the figure.
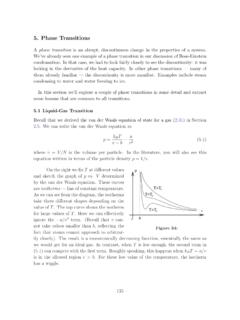
5 It is now evidently convex, as return to it is useful do a Legendre transformation. SincedAD SdT PdVthe Legendre transform ; . P/V:(6)2 This can be constructed by the intercept-slope interpretation of the transformation: asVvaries slide a ruler along to make a tangent at the pointV, and read off the slope Pandthe interceptG. After some struggle you should be able to see that is as sketchedin the second panel of the figure. (PortionsIandIIcorrespond in each figure, and the dashed(red) and dotted (green) of the unphysical portions also correspond.) Note that thewholeof thecommon tangent part of the maps into thesinglepoint of discontinuity , defining the unique pressure for liquid-gas equilibrium at each Alsonote that the physical portion of is concave, as equilibrium pressure can be identified on theP Vby noting that the integral of@G=@Paround the loop of unphysical solutions is zeroIPlg@G@PdPD0 DIPlgVdP:(7)The final expression is the area between theP Vcurve and thePaxis.
6 ThusPlgis identifiedby theMaxwell equal areaconstruction ( ) Plgmust be chosen so that the shaded regionsPVPlgFigure 3: Maxwell construction(which contribute toHVdPwith opposite signs) must be equal. Thus the physicalP Vcurveis given by the solid (black-blue-black) curve, and the unphysical portions are now shown with thesame scheme as in the previous type of transition is afirst orderphase transition . Notice the properties: The second derivative of the thermodynamic potential iszero(the straight portion )orinfinite(the cusp ). As a function of the extensive variableVthere is a region (betweenVlandVg)ofphasecoexistence.
7 The densities of the extensive variables of the two phases in equilibrium arediscontinuousacross the transition ( the density, and also the entropy density, Helmholtzfree energy density).3 On the other hand the temperatureT, pressureP, and Gibbs free energy densitygDG=N, arecontinuousacross the transition . Sincegis equal to the chemical potential , this correspondsto the usual condition between two systems in contact under exchange of energy, volume,and particles. The constraint that the chemical potentials are equal for the phases (labelled one and two) ;P/D ;P/(8)provides asingle constrainton the two variablesT;P, two Phase coexistence occursalong a line in theP;Tplane an example of theGibbs Phase rule.
8 Using this expressionat nearby points on the coexistence line and the thermodynamic identityd DdgD sdTCvdP(9)withsDS=Nthe entropy density andvDV=Nthe volume per particle gives theClausius-Clapeyronrelation for the slope of the coexistence linedPdT coexistenceD1s1v(10)with1sDs2 s1and1vDv2 v1. (if we include the (green) dotted portions) appears to be simply the curvesfor two different phases (liquid and gas) that happen to cross, and the system switchesto the curve of lowerG. The dotted (green) portions are often considered as describing a supercompressed gas or superexpanded liquid (cf. supercooled water at the water-icetransition).
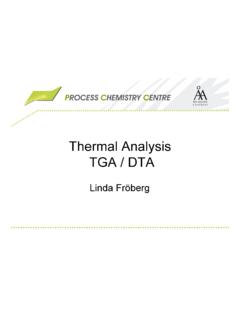
9 However more careful analysis [S. Katsura,Adv. , 416 (1963),Physics3, 255 (1967), A. F. Andreev,JETP18, 1415 (1964)] shows that this interpretation is onlyqualitatively correct, and in fact there is anessential singularityof the free energy curves atthe junction thus get the picture of the Phase transition shown in Fig. (4a).PTliquidgasfirst orderVTVlVg(b)(a)liquidgasVSVlVg(c)liqui dgasSgSlFigure 4: Liquid-gas transition in theVT,PT, andVSplanes. The thintie linesin the mixedphase regions link the two coexisting can alternatively ask what happens if we maintainNparticles at a fixed temperature and changethe pressure rather than the volume.
10 In this case, as the pressure is raised from the low pressure gasphase, when the pressure reached the gas-liquid equilibrium pressure there will be adiscontinuousjumpin the volume as all the gas changes to liquid at this pressure. This is sketched in Fig. (4b).Note that the two phases coexist along alinein thePTplane. The two coexisting phases also havedifferent entropy densities, and so in theSVplane the transition will appear as in Fig. (4c).The van der Waals equation predicts that the liquid-gas transition disappears above a critical below, the discontinuities in the density, entropy density the liquid and gas become smaller and smaller, and disappear at a critical temperatureTc,critical pressurePc.