Transcription of A BEGINNER’S GUIDE TO SAS - Academic Press
1 A beginner S GUIDE TO SAS Notes on the language. SAS programs are written in statements. Each statement ends in a semi-colon, like this ; Statements are arranged in sections, or paragraphs. There are two kinds of paragraphs: a. DATA paragraphs, which read in data and create a working file for SAS to use, or which alter existing data sets. If desired, you can create new variables from old variables in this kind of paragraph. b. PROC paragraphs, which process a data file in various ways. They can perform tasks as mundane as printing a data set, to as sophisticated as very fancy modeling. There are hundreds of PROCs in SAS, each with its own syntax.
2 The last statement in any paragraph should usually be RUN; which directs SAS to execute the paragraph. Comment statements can be used to help document your program. To make a short comment, just start the statement with a * and end it with a ;. Everything in between is a comment. Sometimes it is useful to block out large sections of a program. Then you can start the commented out section with /*, and end it with */. Everything in between will be treated as a comment. Because SAS uses ; to distinguish statements, you can type several statements on a single line. Statements can begin and in anywhere on a line, and wrap onto another line.
3 The Structure of Data sets. Like most statistical software, the default assumption in SAS is that in any data set, there is one line of information for each person (or unit in the sample). For example, suppose I have measured both Gender and Reading Scores for each of 5 third-graders. I would decide which variable will go first and which second, and stick with that decision. Suppose, for example, that I had decided to put Gender first (coded as B for boys and G for girls) and weight second. My data set might look like B 62 G 71 B 84 G 79 B 74 Note that here each record consists of one line. That is the default in SAS. However, sometimes you might have so many variables that the typing for one person will wrap over to multiple lines, that is, each record is more than one line.
4 SAS can handle that too. The key is that for each record, the variables always have to be in the same order. 1A Really Simple Program Here is a simple example to read in the data above, and calculate means and standard deviations. data reading; the keyword data tells SAS you are beginning a data paragraph. the dataset will be called reading . This is optional, but useful in complicated programs with several data sets. input gender $ score; gives names to the variables. the $ following gender tells SAS to expect characters for gender, not just numbers. cards; tells SAS the data lines are about to follow; more modern is to use B 62 statement datalines; G 71 B 84 G 79 B 74 ; tells SAS the lines of data are complete run; tells SAS to execute the preceding paragraph, that is, create the data set proc means; Proc Means tabulates simple statistics on data sets var score; calculte means and standard deviations for the reading scores; class gender; classifying them by gender first, that is separately for boys and girls.
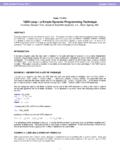
5 Run; tells SAS to execute the preceding paragraph (Proc Means). 2 RUNNING A SAS SESSION When you double-click on the SAS icon, you see a screen similar to that shown below: The main panel on the right side shows a glimpse into two of the three most important windows: The Log window, top, which shows information regarding any job you submit to SAS, including error messages. The bottom panel is the Editor, where you will enter the program statements that control your program. By clicking the maximize button on any window you increase it to full-size. Maximize the editor window and type in the program given in the preceding introduction (eliminating the explanatory comments that follow the arrows).
6 After you finish typing, your editor should look like the screen shown on the next page. Note that SAS will colorize comments green as you type, and certain keywords will come up in blue. (see screen picture on next page) TO RUN YOUR PROGRAM: You can Press F8, or you can click on the running man icon on the top toolbar. If you wish, you can highlight only a section of your program, then when you Press F8 only those lines are processed. 3 TO LOOK AT THE OUTPUT: Text output, like the tables from Proc Means, come into the output window. Graphical output appears in a Graphics output catalog. If your program ran successfully, what you see on the screen will be whatever ran last graphics or text.
7 Here is the Output you should see after running the program. 4 MOVING BETWEEN WINDOWS - You can move back and forth among the windows. Either click on the Window item in the top toolbar and highlight the desired window, or Editor Press F5 Log Press F6 Output (text) Press F7 Graphs Click on the Results tab, bottom left, then doubleclick on the desired graph SAVING YOUR PROGRAM You can save your program by moving to the Editor window, then calling up FILE > SAVE, and filling in the location and name of the file. It should be saved with the extension .sas. EXITING SAS In the usual Windows way, just do FILE > EXIT. It will ask if you are sure you want to quit.
8 If you haven t recently saved your program, it will ask if you wish to do so. A MORE ADVANCED EXAMPLE In this example, you will learn to read in a flat ASCII file that has been stored in some external data base. As an example, we will look at a data set that contains cholesterol, ages, and sex which has been stored as Save this file to your computer and make a note of the location and name of the file. You will need the full location, sometimes it is easiest to open the file and copy its location as text so you can paste it into the SAS Now return to SAS. If you are not already there, move to the editor window using F5. Clear the window, by selecting EDIT > CLEAR ALL.
9 Type in the following program, eliminating my explanations that start with the arrows. data cholesterol; infile 'put your path/filename here!'; <- use pathname where you stored the data, in single quotes. input id chol age sex $; <- sex is coded as M or F. run; proc univariate; <- proc univariate is similar to proc means but much more detailed. var chol; class sex; histogram chol; run; Some of the output will be sent to the Output window which you access using the F7 key. The histogram will be sent to the Graphics window. You close the Graph by clicking the close button. You get back to it by looking at the Results box on the left, and finding the output marked with a graph icon.
10 Suppose that you were writing a report on the differences between cholesterols for men and women. One of the things you might put into the report is the histogram. Try this: Minimize SAS (do not exit it), and open a document in Word. Leave Word open, and 5return to SAS s graphics window with the histogram showing. Right-click on the histogram, and choose EDIT > COPY. Now return to the Word document, and paste in the histogram. Save your document frequently. Try obtaining a scatterplot of Cholesterol versus Age, using Proc Gplot; Plot Chol*age=sex; Run; In the Plot statement, the Y variable goes to the left of the *, and the X variable to the right.